Presented at the GRC and SEG
For a PDF of this paper click here
Summary
A ZTEM™ (Z Tipper Axis Electromagnetic) airborne AFMAG survey was conducted over the Pampa Lirima geothermal project where a number of other ground geophysical surveys had been previously undertaken, including magnetotelluric (MT) soundings. The ZTEM™ survey at Pampa Lirima overflew the area for comparison.
The ZTEM™ results appear to correlate well with previous geophysics and the known geology, including known fault structures and contacts, as well as a prominent conductivity high over the Lirima hot spring field. 2D-3D inversions of the airborne ZTEM™ appear to agree quite well with 3D inversion of ground MT for shallower depths (<2km), in particular the conductive clay-cap attributed to the deep 3D MT conductive heat source and a resistive NE-SW lineament that extends between the Lirima and San Andrés hot springs.
Introduction
A ZTEM™ (Z-Tipper Axis Electromagnetic; Lo and Zang, 2008) airborne AFMAG survey was conducted over the Pampa Lirima geothermal prospect in northern Chile (Figure 1) in December, 2010. Resistivity and EM methods are used in geothermal exploration to map the electric properties of the geology at depth. However, while these preferred methods, like ground magnetotellurics (MT), provide excellent depths of investigation and resolution, they come at a very high cost. ZTEM™ is an airborne variant of the tipper AFMAG method (Ward, 1959; Labson et al., 1985) that is capable of mapping the electrical properties of geothermal systems over large areas (Devriese et al., 2012), in conjunction with MT (Legault et al., 2010; Lazaro et al., 2011; Legault et al., 2011; Legault et al., 2012b), to reasonably great depth (>1km), at a fractional cost of ground geophysical methods. The ZTEM™ survey was flown to test its capability as a reconnaissance resistivity mapping tool and in direct comparison with magnetotelluric and other ground geophysical results.
The Pampa Lirima project area (Arcos et al., 2011), belonging to Energía Andina, a Chilean geothermal energy company, is located in the Altiplano of northern Chile, approximately 1700 km north of Santiago, near the Bolivian border, in a region of high heat flow and known geothermal prospectivity (Figure 1). Pampa Lirima is long well known for its hot springs and several known geothermal occurrences lie within the survey area, including Termas Lirima to the west, Baños San Andrés further northeast and Baños Chalviri to the northeast, and also Termas Cancosa, southeast of the property (Figure 2).
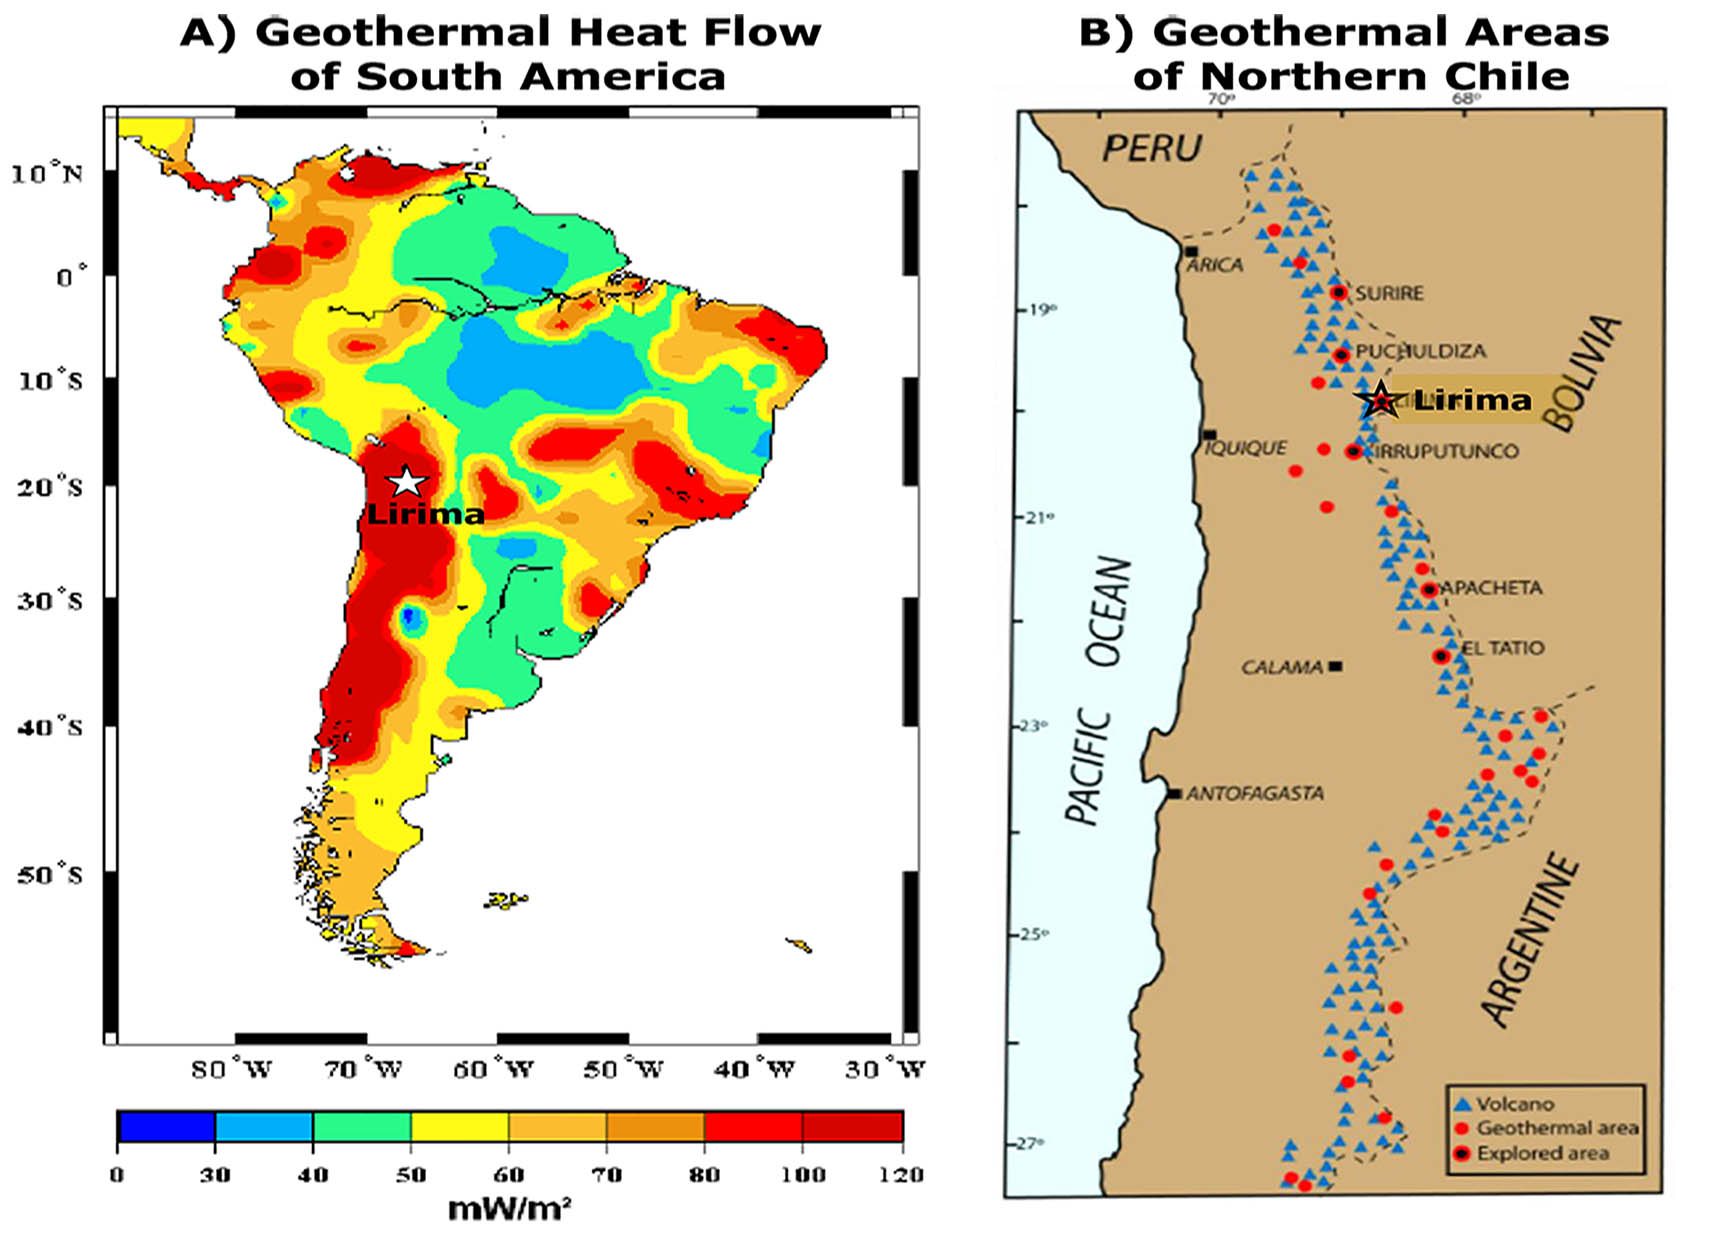
Figure 1: Showing Pampa Lirima in: a) geothermal heat flow map of South America; and b) geothermal areas of Northern Chile (after Haraldsson, 2012).
The Pampa Lirima ZTEM™ survey consisted of 1630 line-km over a 675km2 area using the helicopter-towed ZTEM™ system, as well as combined aeromagnetics. The survey consisted of 18-95 km long, N-120O oriented flight lines obtained at nominal 425m line spacings. Z-axis tipper measurements of the vertical (Z) component were obtained using an induction aircoil sensor, suspended at approximately 90m elevation above ground level. The vertical component time-series data (Hz) were acquired at 2k Hz, then merged with similarly sampled horizontal field measurements (Hx-Hy) from fixed base-station reference coils, in order to obtain the tipper vectors Tzx (in-line) and Tzy (cross-line). The ZTEM™ tipper In-Phase and Quadrature transfer functions were derived from 1.0sec time-series using Fourier-based, digital signal processing analyses, and then were output at 2.5Hz (~10m stations) for 6 frequencies, between 25Hz and 600Hz.
Geologic Setting
The geology of the Pampa Lirima prospect (Figure 2) consists of: a) basement Mesozoic carbonate rocks that form a folded and thrusted belt and Cretaceous volcanics that cover the older sediments in angular unconformity; b) Oligocene-Miocene volcanic and sedimentary cover rocks are 500-700m thick and strongly folded; c) covering these rocks are middle-Miocene to Pleistocene volcanic edifices, that form the mountain peaks, reaching to great altitudes and featuring varying degrees of erosion, with large volumes of accumulated material. Structurally, a series of NS, NW and NE oriented structures affect the Oligo-Miocene cover rocks as well as the Mesozoic basement (Arcos et al., 2011).
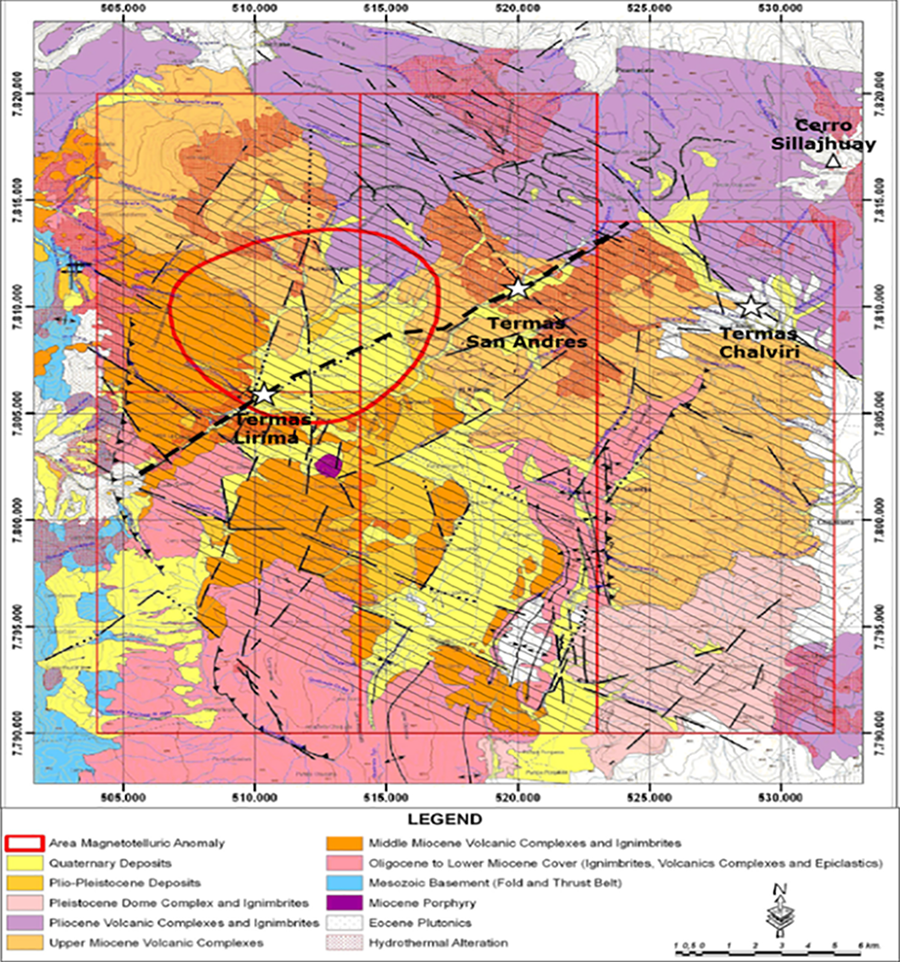
Figure 2: Geological map of Lirima area, with property boundary (red polygons), ground MT deep conductive anomaly (red circle), interpreted major lineament (black dashes) and ZTEM™ flight (grey lines) lines (after Arcos et al., 2011).
The Pampa Lirima survey area is distinguished by its many sectors with distinct colour anomalies, due to hydrothermal alteration and iron oxide staining. The alteration styles range from argillic (illite-smectite), phyllic (illite-sericite-muscovite) and advanced argillic (silica-alunite-kaolinite). At San Andrés, the alteration is covered by relatively fresh Miocene lavas, unaltered Pliocene volcanics and locally by till deposits. At Lirima, the altered rocks that extend over a large area are gradationally covered by unaltered to altered Miocene lavas (Arcos et al., 2011). Geologically, the Lirima and San Andrés geothermal systems, which are in the Coscaya River basin and its tributary, both lie along the same NE-SW alignment (Figure 2) and each is associated with large areas of steam-heated type argillic to advanced argillic hydrothermal alteration. The Chalviri geothermal hot springs, which drain into the Cancosa Basin further southeast, are located in a NW-SE lineament that marks the contact between upper Miocene volcanic complex and the large Pleistocene volcanic edifice of Cerro Sillajhuay to the north (Arcos et al., 2011).
Previous Geophysics
The Pampa Lirima geothermal prospect has been host to a number of geophysical surveys, including regional airborne magnetics across the entire property, micro seismic and magnetotelluric coverage spanning the Lirima and San Andrés area (Arcos et al., 2011), as well as individual lines of vertical electrical resistivity soundings (VES) and time-domain EM (TDEM) sounding directly across the Lirima and San Andrés fields (I. Aguirre, pers. comm., 02-2011).
The MT survey consisted of 82 site full tensor sites, across the 0.003-10k Hz frequency range, over the Lirima-San Andrés region. These results were then fed to a 3D inversion, using the Mackie and Madden (1993) code for further interpretation (Arcos et al., 2011).
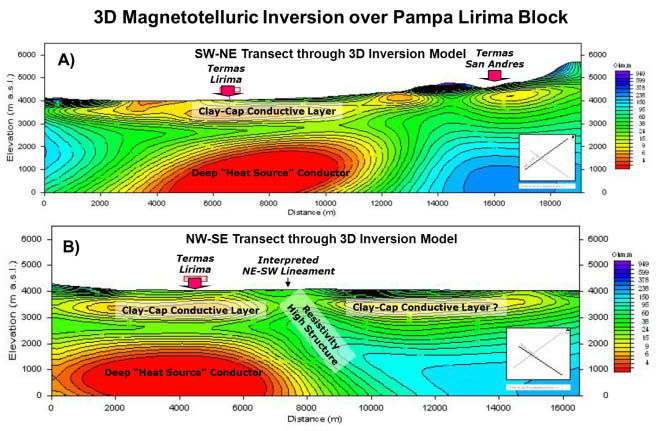
Figure 3: 3D Magnetotelluric inversion results, showing: a) NE-SW and b) NW-SE oriented sections across the 3D model (after Arcos et al., 2011). Their location is approximated by the 2D ZTEM™ inversion lines shown in Figure 4 (after Arcos et al., 2011).
The 3D inversion results (Figure 3) indicate that the south to southwestern survey area is underlain by a shallow conductive layer (<10 ohm-m) within 1000m below the surface, that is interpreted as the clay cap (argillic alteration) of the geothermal reservoir. This clay cap conductive layer is in turn interrupted in the center by a higher resistivity zone (see Figure 3b) that coincides with the regional NE-SW lineament interpreted from the regional geology and aeromagnetic data.
More importantly, in the southwestern corner of the survey area, below the upper clay-cap conductive layer, a very large (8x8x2km thick) distinctive, deep conductive body is observed at >2km depths. A massive, partially melted intrusive body is given as a possible explanation for this anomaly, which is interpreted to be the heat source for the geothermal system. This would distinguish Pampas Lirima from more typical active volcanic systems elsewhere in the Andean environment, whose heat sources are usually deep resistive bodies (Arcos et al., 2011).
ZTEM™ Survey Results
Tipper AFMAG data, by their nature, typically exhibit cross-over behaviour over lateral heterogeneities (Ward, 1959; Labson et al., 1985). The In-Phase (IP) Total Phase Rotation (TPR) results, shown in Figure 4, are representations of the ZTEM™ tipper data that convert cross-overs to single-peak responses while allowing the orthogonal Tzx and Tzy components to be combined. Analogous to the DT (Lo and Zang, 2008) and also the Peaker parameter, used in VLF (Pedersen, 1998), the TPR grid imaging of geoelectric structures is omni-directional, with all orientations being highlighted.
Whereas higher frequency TPR images highlight the shallower geologic features that are mainly influenced/controlled by topography, the lower frequency 25Hz IP TPR in Figure 4 images the deeper, bedrock geology. This is highlighted using the structural geology overlay from Figure 2. Clearly the ZTEM™ resistivity images are defining the same major features identified in the geology – with NE-SW and NW-SE, and also more NS structures; as well as others, including a prominent short strike-length NE-trending conductivity high feature that coincides with the known Lirima geothermal target area. This feature can also be followed as a narrow resistivity break further to the northeast to San Andrés, where a major resistivity contact is defined along the quebrada that coincides with a fault-contact between younger Pleistocene volcanics to the NW and older Miocene volcanic basement to the SE. A similar, but subtler, NW-SE oriented resistivity contact is also defined in the lower frequency TPR along the same type of Miocene-Pleistocene contact that controls the Chalviri hot springs structure. Several other prominent linear ZTEM™ conductive anomalies, similar to that found at Lirima, are also defined below the pampa overburden cover elsewhere in the Coscaya River Basin, further to the southeast.
ZTEM™ 2D-3D Inversion Results
The ZTEM™ survey tipper results can be converted to their equivalent resistivity-depth source model using 2D or 3D MT inversion codes that can be adapted for ZTEM™ by accounting for the air layer, as well as the mobile Hz and fixed Hx base stations. Two-dimensional (2D) inversions of the ZTEM™ data were calculated using the Geotech Av2dtopo (Legault et al., 2012) that also accounts for 2D ground topography and implements a depth-of-investigation (DOI) index (see Figure 5), using the 1.5x MT maximum skin depth and integrated 1D conductance method of Spies (1989). The 2D inversions used the In-line (Tzx) In-Phase and Quadrature Phase data from all six measured frequencies (25-600Hz). Based on previous ground resistivity results, a 100 ohm-metres half-space was used as the apriori starting model.
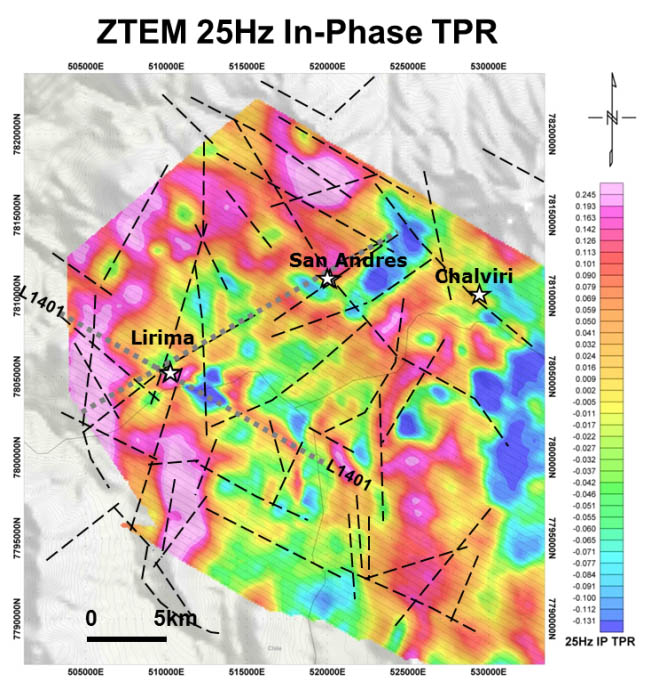
Figure 4: ZTEM™ 25 Hz In-phase Total Phase Rotation (TPR) tipper results, with locations of geothermal hot spring (stars) and geologic structures from Figure 2. Approximate location of 3D MT sections in Fig. 3b (black dash) and ZTEM™ 2D inversion in Fig. 5.
Figure 5 presents the ZTEM™ 2D inversion results for L1401, a NW-SE section directly across the Lirima geothermal field (see Figure 4) that roughly coincides with the NW-SE trending 3D MT section shown in Figure 3b. A 3D resistivity voxel model was created by combining the 2D inversions and gridding them in 3D space. Figure 6 presents a 2D resistivity iso-depth slice at 500m depth. Although skin depth DOI estimates suggest that the ZTEM™ does not image below 1.5-2km depths and therefore cannot corroborate the deep MT “intrusive” conductive body, there is nevertheless reasonable similarity between the 2D ZTEM™ sections and the shallower portion of the 3D MT model
References
Arcos, R., J. Clavero, A. Giavelli, S. Simmons, I. Aguirre, S. Martini, C. Mayorga, G. Pineda, J. Parra, and J. Soffia, 2011, Surface exploration at Pampa Lirima geothermal project, Central Andes of Northern Chile, Geothermal Resources Council Transactions, 35, 689-693.
Devriese, S.G.R., D.W. Oldenburg, and J.D. Shoffner, Three-dimensional inversion of ZTEM data at the Elevenmile Canyon geothermal system, Nevada, Geothermal Resources Council Transactions, 36, 995-999.
Haraldsson, I.G., 2012, Geothermal activity and developments in South America: A short overview of Bolivia, Chile, Columbia, Ecuador, and Peru, a paper presented at “Short Course on Geothermal and Geothermal Wells”, United Nations University UNU-GTP Geothermal Training Programme, 18p.
Holtham, E., and D.W. Oldenburg, 2008, Three-dimensional forward modelling and inversion of Z-TEM data, SEG, Expanded Abstracts, 564-568.
Labson, V.F., A. Becker, H.F. Morrison, and U. Conti, 1985, Geophysical exploration with audio frequency natural magnetic fields, Geophysics, 50, 656-664.
Lazaro, M., S. Alm, A. Tiedeman, C. Page, D. Meade, J. Shoffner, and K. Bucher, 2011, Department of the Navy Geothermal Exploration on Naval Air Station Fallon (NASF) Managed Lands in Dixie Valley, Nevada, Geothermal Resources Council Transactions, 35, 873-878.
Legault, J.M., J.B. Witter, P. Berardelli, and M. Orta, 2010, ZTEM airborne AFMAG EM results over the Reese River geothermal test area, central Nevada, 21ST ASEG International Geophysical Conference and Exhibition, Australian Society of Exploration Geophysicists, Extended Abstracts, 4p.
Legault, J.M., J.B. Witter, P. Berardelli, S. Lombardo, and M. Orta, 2011, Recent ZTEM airborne AFMAG EM survey results over Reese River and other geothermal test areas, Geothermal Resources Council Transactions, 35, 879-884.
Legault, J.M., S. Lombardo, S. Zhao, J. Clavero, I. Aguirre, R. Arcos and E. Lira, 2012, ZTEM airborne AFMAG EM and ground geophysical survey comparisons over the Pampa Lirima geothermal field in northern Chile, Geothermal Resources Council Transactions, 36, 1001-1008.
Lo, B., and M. Zang, 2008, Numerical modeling of Z-TEM (airborne AFMAG) responses to guide exploration strategies, SEG, Expanded Abstracts, , 1098-1101.
Mackie, R.L., and T.R. Madden, 1993, Three dimensional magnetotelluric inversion using conjugate gradients. Geophysical Journal International, 115, 215-229.
Pedersen, L.B., 1998, Tensor VLF measurements: Our first experiences, Exploration Geophysics, 29, 52-57.
Spies, B., 1989, Depth of investigation in electromagnetic sounding methods, Geophysics, 54, 872-888.
Ward, S. H., 1959, AFMAG – Airborne and Ground: Geophysics, 24, 761-787