For a PDF of this paper click here
Introduction
ZTEM™ (Z-Tipper Axis Electromagnetic) surveys were conducted over the Mt-Milligan Test Block, belonging to Terrane Metals Corp. (Vancouver, BC) and situated in the Mackenzie region of central British-Columbia, from October 15TH to 22ND, 2008, on behalf of Geoscience BC. The ZTEM survey comprised airborne Tipper AFMAG (audio frequency electromagnetics) measurements, as well as aeromagnetics using a caesium magnetometer. The survey consisted of twenty five (25) approx. 8.0 km long, EW oriented flight lines, totaling 200 line-km, that were obtained at nominal 250m line spacings over an approximately 6 x 8 km area (Figure 1). The area was chosen because it hosts the Mt Milligan copper-gold porphyry deposit, containing a Measured and Indicated Mineral Resource of 590.8 Mt at 0.193% Cu and 0.352 g/t Au containing 2.52 billion lb copper and 6.70 million oz gold (Terrane Metals Corp. 2008), that is not yet in production, and also because area’s geology is well known and available in the public domain – making it an ideal case-history example.
Body text The Z-axis tipper measurements of the vertical (Z) component were obtained using Geotech’s patented ZTEM induction aircoil system (Figure 2), suspended at approximately 110m elevation above ground level. The vertical component data (Hz) were then ratioed to fixed horizontal field measurements (Hx-Hy) obtained using identical reference coils, that were oriented in the in-line (X) and cross-line (Y) directions, in order to obtain the tipper functions Z/X and Z/Y. The In-Phase and Quadrature components ZTEM field ratio data were obtained, using Fourier-based, digital signal processing analyses, at 5 frequencies, between 30Hz and 360Hz. The magnetometer was a Geometrics proton-precession model towed at 130m above ground level.
General Theory
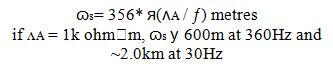
The ZTEM system uses naturally occurring Afmag magnetotelluric fields as the source of the primary fields, and therefore requires no transmitter (Ward, 1959). The fields resemble those from VLF except that they are lower frequency (tens & hundreds of Hz versus tens of kHz) and are not strongly directionally polarized (Labson et al., 1985). These AFMAG EM fields, derived from world-wide atmospheric thunderstorm activity, have the unique characteristic of being uniform, planar and horizontal, and also propagate vertically into the earth – to great depth, up to several km, as determined by the magnetotelluric (MT) skin depth, which is directly proportional to the ratio of the bedrock resistivity to the frequency. At the frequencies used for ZTEM, the MT skin depths range between 600m to 2km in this region of the Athabasca Basin, according to the following equation for skin depth (Vozoff, 1972):
The other unique aspect of AFMAG fields is that they react to relative contrasts in the resistivity, and therefore do not depend on the absolute conductance, as measured using inductive EM systems, such as VTEM – hence poorly conductive targets, such as alteration zones and fault zones, can be mapped, as well as higher conductance features, like graphitic units. Conversely, resistive targets can also be mapped using AFMAG–provided they are of a sufficient size and contrast to produce a vertical field anomaly. Indeed resistors produce reversed anomalies relative to conductive features. An example of a ZTEM 2D forward model profile response over a conductive body is given in Figure 3.

Figure 1: ZTEM Hz Receiver Coil (foreground) and Hx-Hy Reference Coils (background).
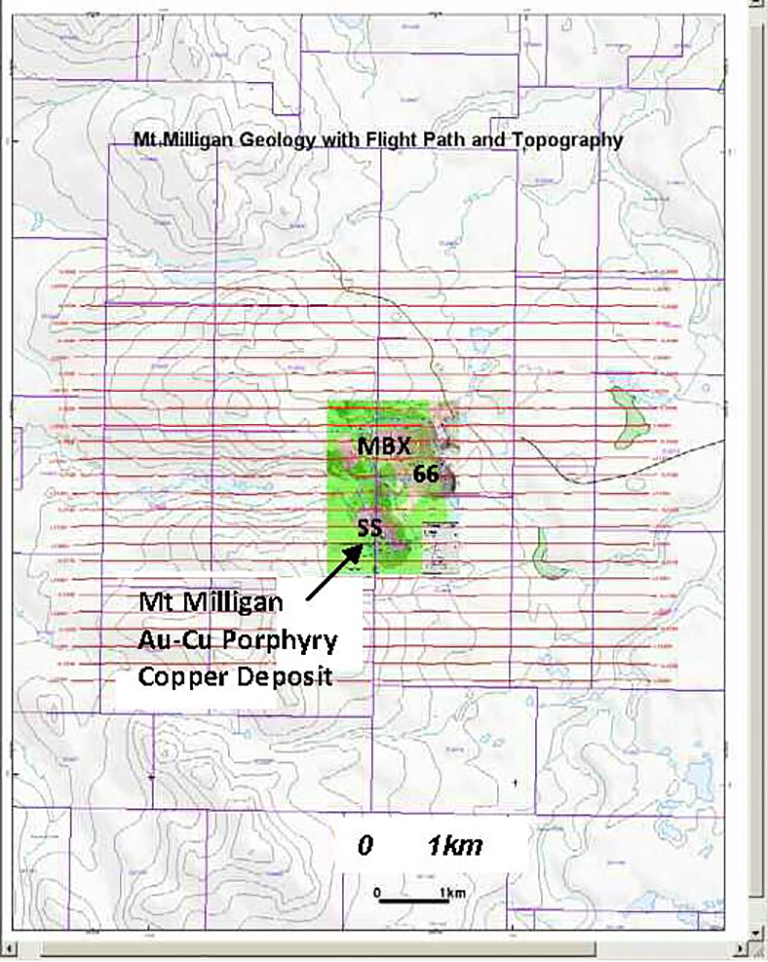
Figure 2: Mt. Milligan Test Block ZTEM Flight Lines and Deposit Geology (after Terrane Metals, 2008).
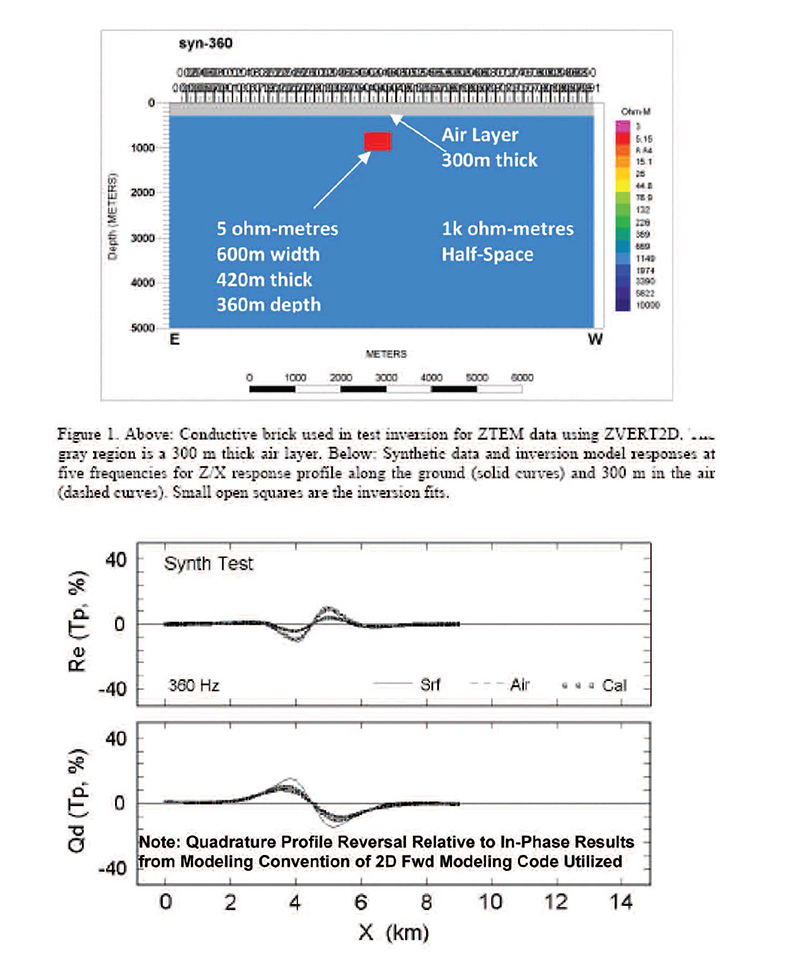
Figure 3: Calculated 2D Forward Model Response for In-Line (Z/X) In-Phase and QP Components over Buried Conductor in Resistive Half Space at 300m Elevation (Ref. Wannamaker, 2008).
General Geology
The Mt. Milligan project is within the Quesnel Terrane, a Late Triassic to Early Jurassic magmatic arc complex (Terrane Minerals Corp., 2008). The Quesnellia rocks consist of Triassic to Lower Jurassic volcanic and minor sedimentary rocks of Takla Group. The Takla Group in the Mt. Milligan area is mainly comprised of an upper, predominantly volcaniclastic Witch Lake Succession with hosts the Mt. Milligan deposits. The Witch Lake rocks are characterized by volcaniclastic and basaltic andesites that are intruded by coeval Takla Group and younger intrusions. Coeval intrusions comprise most of the Mt. Milligan intrusive complex, which consists dominantly of monzonitic rocks – including the MBX, Southern Star, Goldmark and North Slope stocks, all which host mineralization at Mt. Milligan (see Figure 4).
Mt. Milligan is a tabular, near-surface, alkalic copper-gold porphyry deposit that measures some 2500 metres (m) north-south, 1500 m east-west and is 400 m thick (Terrane Minerals Corp., 2008). It consists of two principal zones, the Main Zone and Southern Star (SS) Zone. The Main Zone includes four contiguous sub-zones: MBX, WBX, DWBX and 66, all of which are spatially associated with the MBX monzonite stock and Rainbow Dyke (Figures 4-5). The SS Zone is centred on a monzonite stock of the same name and is some 500 m south of the Main Zone.
Main Zone mineralization and associated alteration are primarily hosted in volcanic rocks, whereas in the SS Zone, mineralization is hosted equally in monzonite stock and volcanic rocks. Mineralization in both zones consists of pyrite, chalcopyrite and magnetite with bornite localized along intrusive-volcanic contacts. The pyritic 66 subzone is notable in that it is comparatively gold-rich and copper-poor.
Copper-gold mineralization is primarily associated with potassic alteration with both copper grade and alteration intensity decreasing outwards from the monzonite stocks. Pyrite content increases dramatically outward from the stocks where it occurs in association with propylitic alteration, which forms a halo around the potassic-altered rocks. In terms of alteration, Mt Milligan features a poorly developed supergene blanket over the deposit with limited supergene enrichment. Potassic alteration is widespread and occurs principally as massive K-feldspar and biotite replacement of fine-grained matrix in porphyritic tuffs and flows. A phase of propylitic alteration consisting of epidote- calcite+/-pyrite-albite-chlorite in part overprints the potassic alteration.
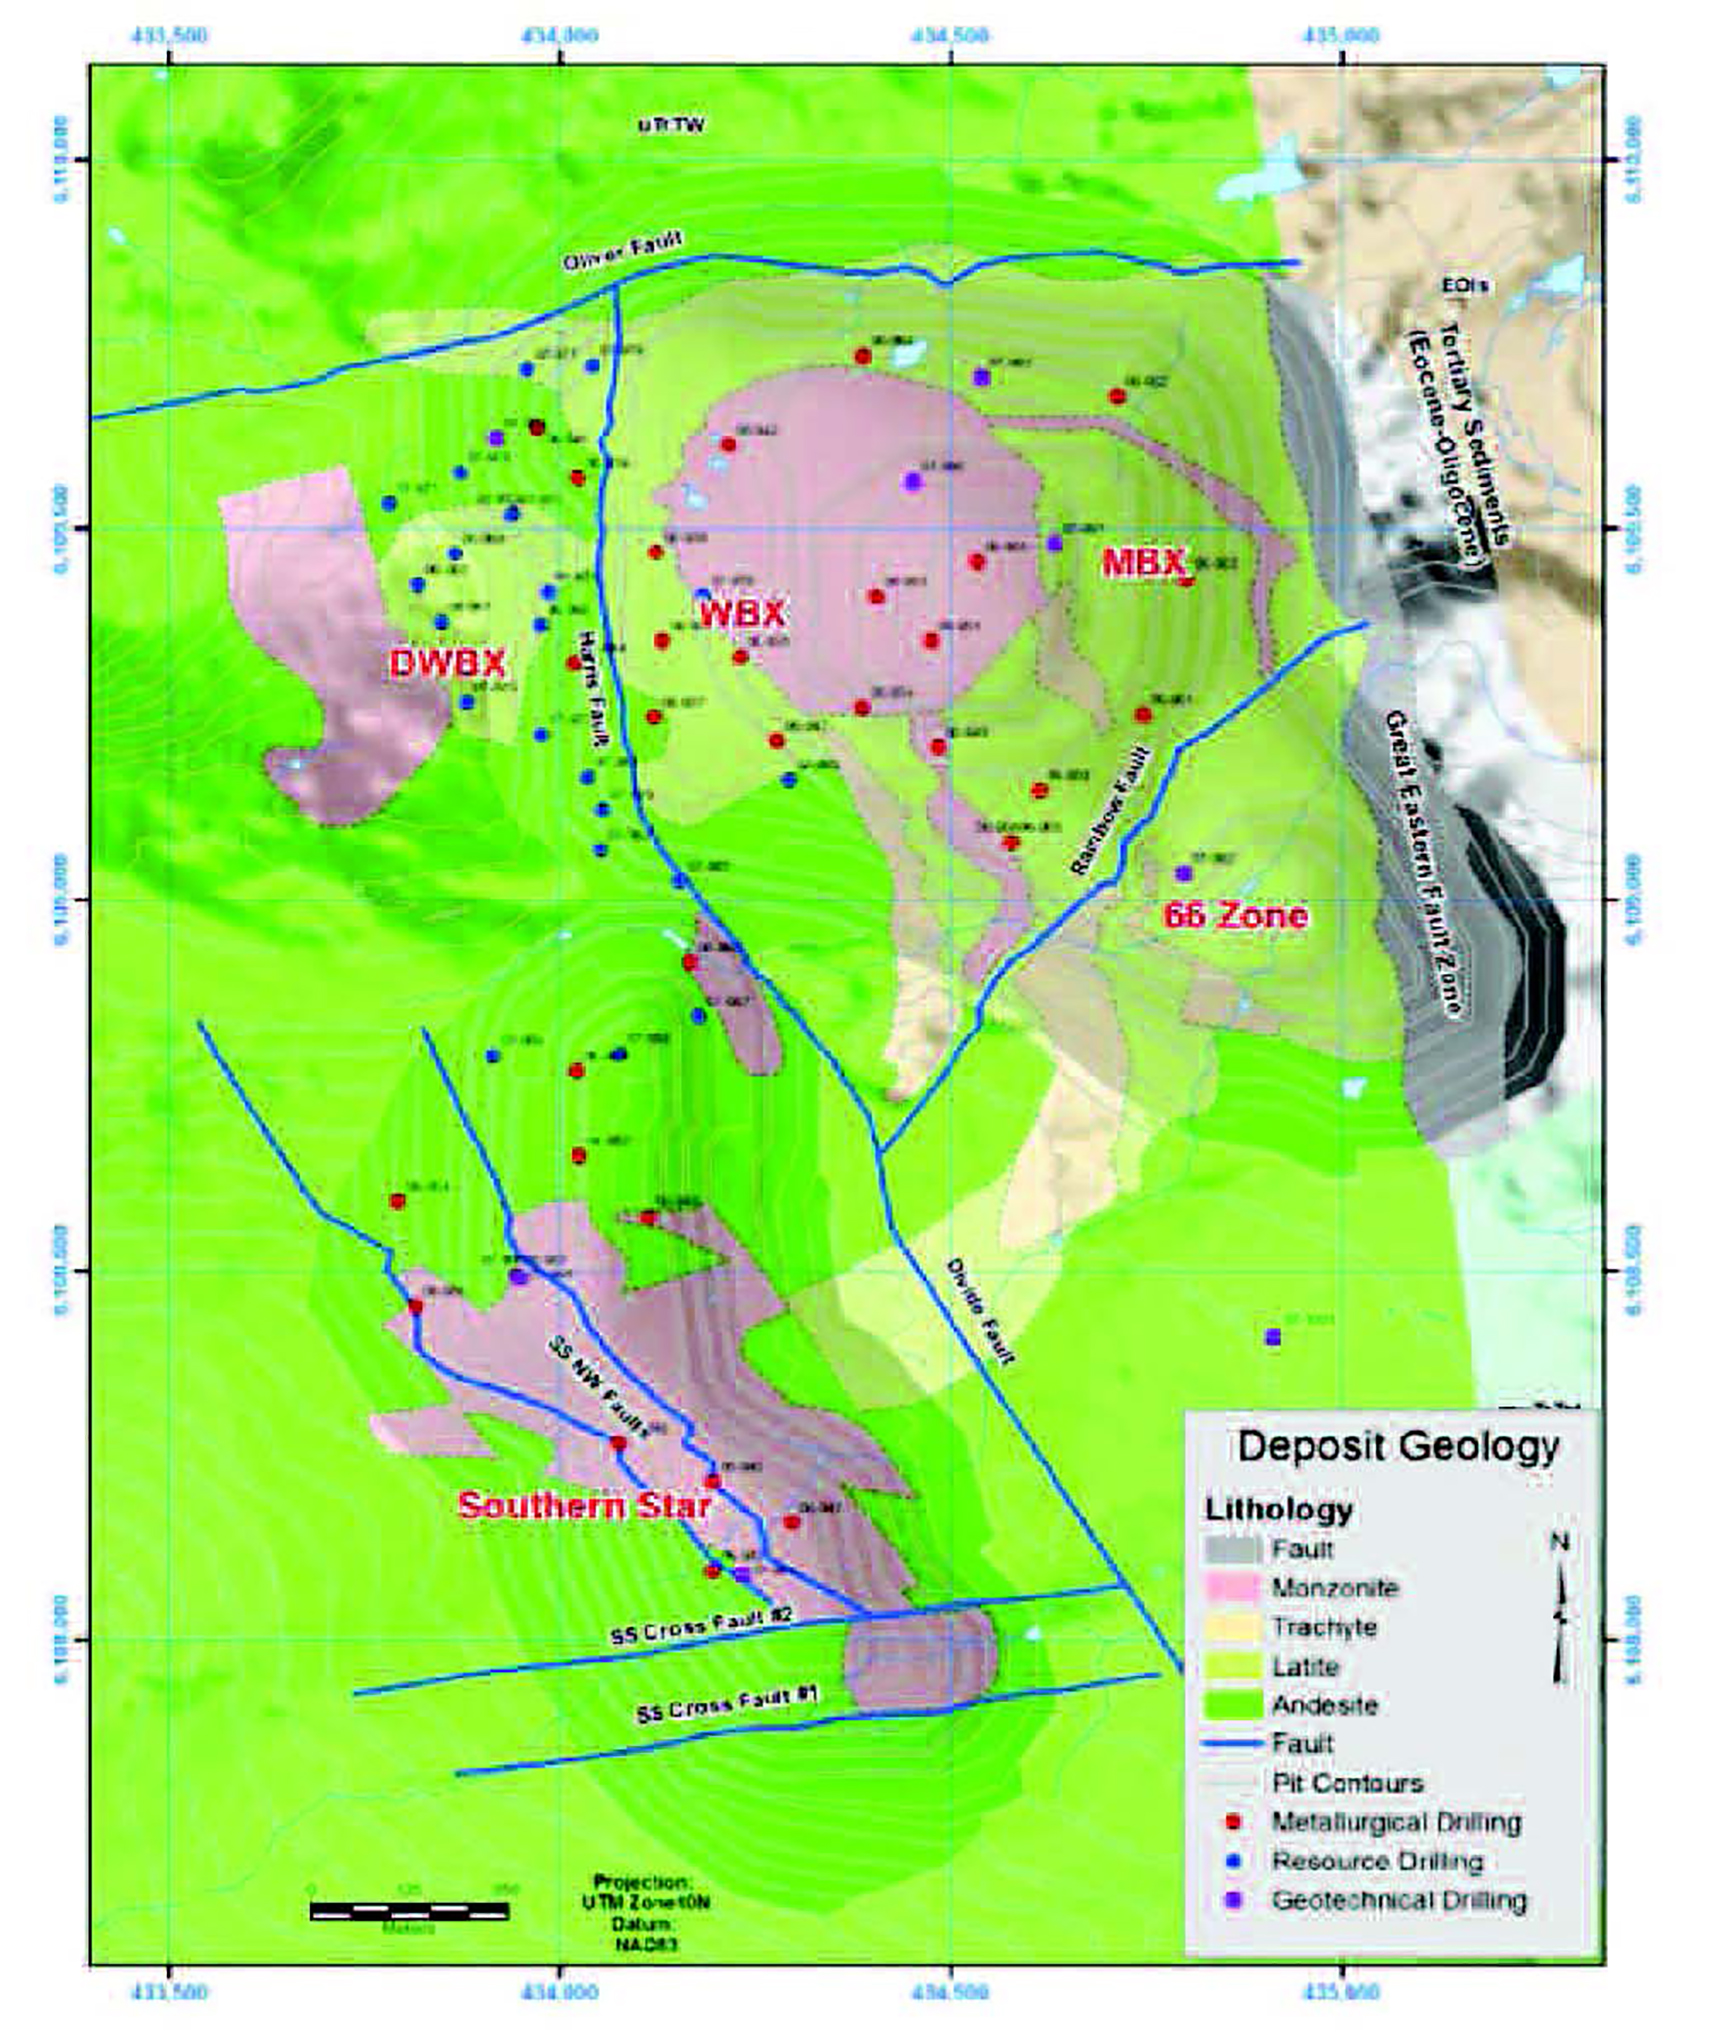
Figure 4: Mt. Milligan Geology and Mineralized Zones (Ref. Terrane Metals Corp., 2008.
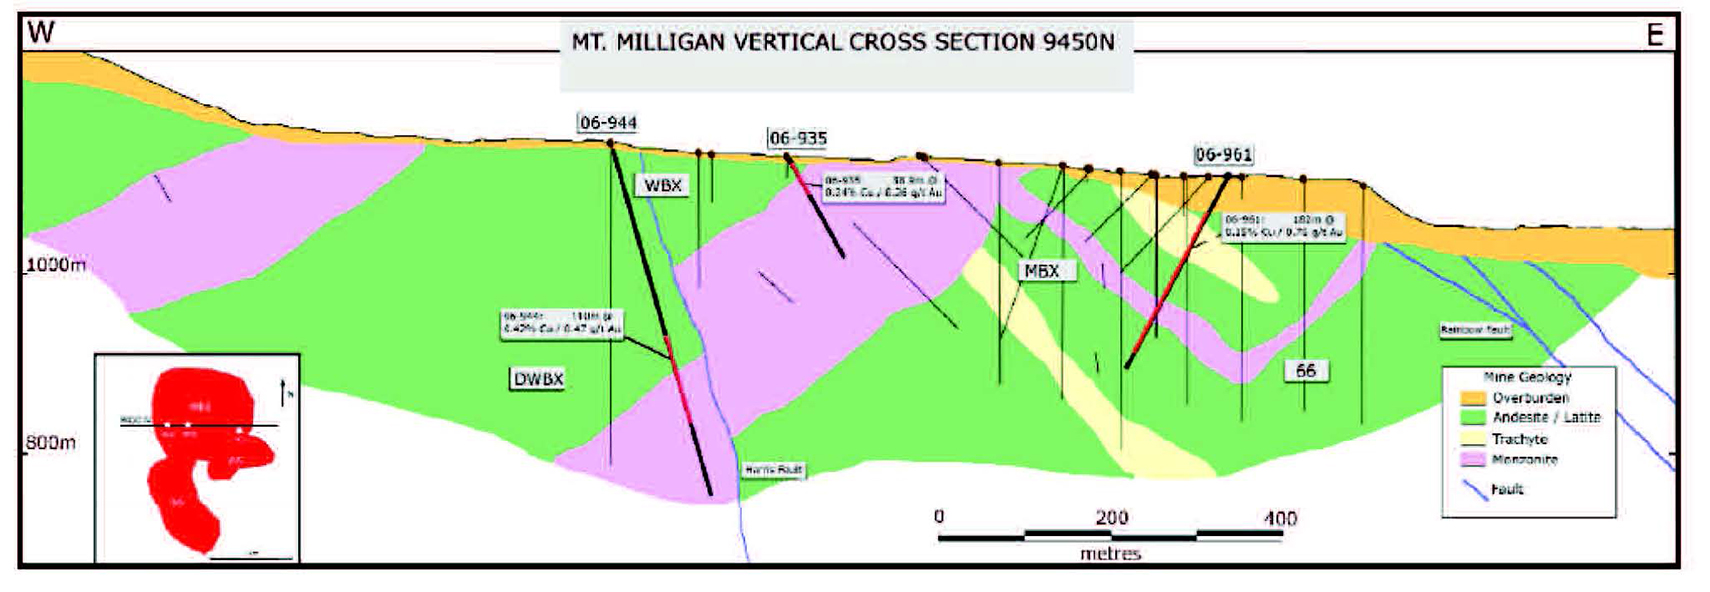
Figure 5: Cross-Section Across MBX Stock at Mt. Milligan (Ref. Terrane Metals Corp., 2008).
In terms of structure, At least four episodes of faulting have effected the area, the earliest being the shallow east-dipping Rainbow Fault. Important east-northeasterly trending cross-faults and northwesterly trending, steeply easterly dipping faults separate the MBX stock from the Southern Star stock. The regional Great Eastern Fault truncates mineralization to the east and juxtaposes Takla Group volcanic rocks against Early Tertiary rocks (see Figure 4).
The Main Zone at Mt. Milligan consists of a number of zones partly within and adjacent to the west-dipping MBX stock (Figure 4). The MBX Zone is the most important Cu-Au zone and is situated along the footwall of the stock and along the Rainbow Dyke (Figure 4). The WBX Zone is a Cu-Au deposit situated along the western hanging wall of the MBX stock. A down-faulted extension to this zone, the DWBX has been displaced vertically along the Harris Fault. To the south, the 66 Zone is essentially gold-only, with a boundary marked by Cu-Au zonation. Mineralization in the Southern Star deposit is hosted in the Southern Star stock. Mineralization extends from the eastern contact of the MBX stock to the Great Eastern Fault.
Mineralization consists of chalcopyrite and lesser bornite and magnetite in areas of potassic alteration, and pyrite in areas of propylitic alteration. Mineralization is best developed in areas of potassic alteration in the footwall. The highest copper-gold grades are related to chalcopyrite adjacent to the MBX and Southern Star stocks. The highest gold grades are in the 66 Zone and are associated with abundant pyrite. Pyrite occurs as disseminations and veinlets, up to 10 to 20%.
Previous Geophysics
Previous geophysics on the property has included IP surveys which outline primarily the pyritic haloes surrounding the intrusions and mineralized zones. Ground magnetic surveys indicate that the MBX and Southern Star stocks are positive magnetic anomalies, although the MBX stock is within an area strongly influenced by the highly magnetic Mt.Milligan Intrusive Complex to the north. Airborne survey covering the area north and west of the deposit area consisted of magnetics and VLFEM. The EM data exhibit a pattern very similar to the IP ground surveys (Terrane Metals Corp., 2008).
Data Presentation
The nature of the AFMAG fields is such that, as with VLF, buried, tabular conductors and resistors produce cross-over responses (see Fig. 3). As such, although the field results are shown as cross-over profiles, additional post-processing is applied to convert these cross-over’s into peak responses, to make them more useful as mapping tools. These include 2 types: the 90-degree Phase Rotation (Lo, et. al, 2008) which is a Geosoft-based FFT process applied to the grid data, and the Total Divergence (DT) which is a summative, horizontal derivative process method (Kuzmin, et al., 2005) – both of these have been used in this test case.
Data Analysis
The Mt Milligan area ZTEM results, in particular, showcase the generally high level of data quality, in terms of signal/noise and well defined anomaly resolution. Particularly given the fact that a) the data were obtained in mid-late October, and therefore not at the peak season of sferic activity – hence at best moderate natural field levels expected; and b) the data were obtained using aircraft flying at ~100km/hr, approximately 100m above ground level – hence without significant stacking or additional processing applied.
Plan View Results
The two In-Phase Tipper profile data (Z/X = In-line – Z/Y = Cross-line) with corresponding 90-degree Phase-Rotated (PR) grids are presented for the 90 Hz frequency, in Figure 6, for comparison purposes. The outline of the Mount Milligan MBX, 66 and SS porphyry deposits are also shown.
There are distinctive differences observed between the Z/X (In-Line) component profile results (Figure 6a), which are most sensitive to structures orientated perpendicular to the In-Line direction- notably the 1-2 major NS structures defined east of the Mt-Milligan porphyry copper deposits, which appear correspond to the known Great Eastern Fault Zone that marks the Tertiary-Quesnel contact. This image contrasts the Z/Y (Cross-line) component profiles (Figure 6b), which are sensitive to structures oriented oblique/parallel to the In-Line flight direction – notably: 1) a probable NW-SE fault structure southwest of Mt Milligan; 2) a possible NE-SW fault structure east of Mt Milligan, and 3) a possible east-westerly structure that bounds the northern edge of the MBX Zone. When the 2 Tippers are combined, using either the PR or DT grid methods, as shown in Figures 7 and 8, the imaging of geoelectric structures becomes omni-directional, with all orientations being highlighted.
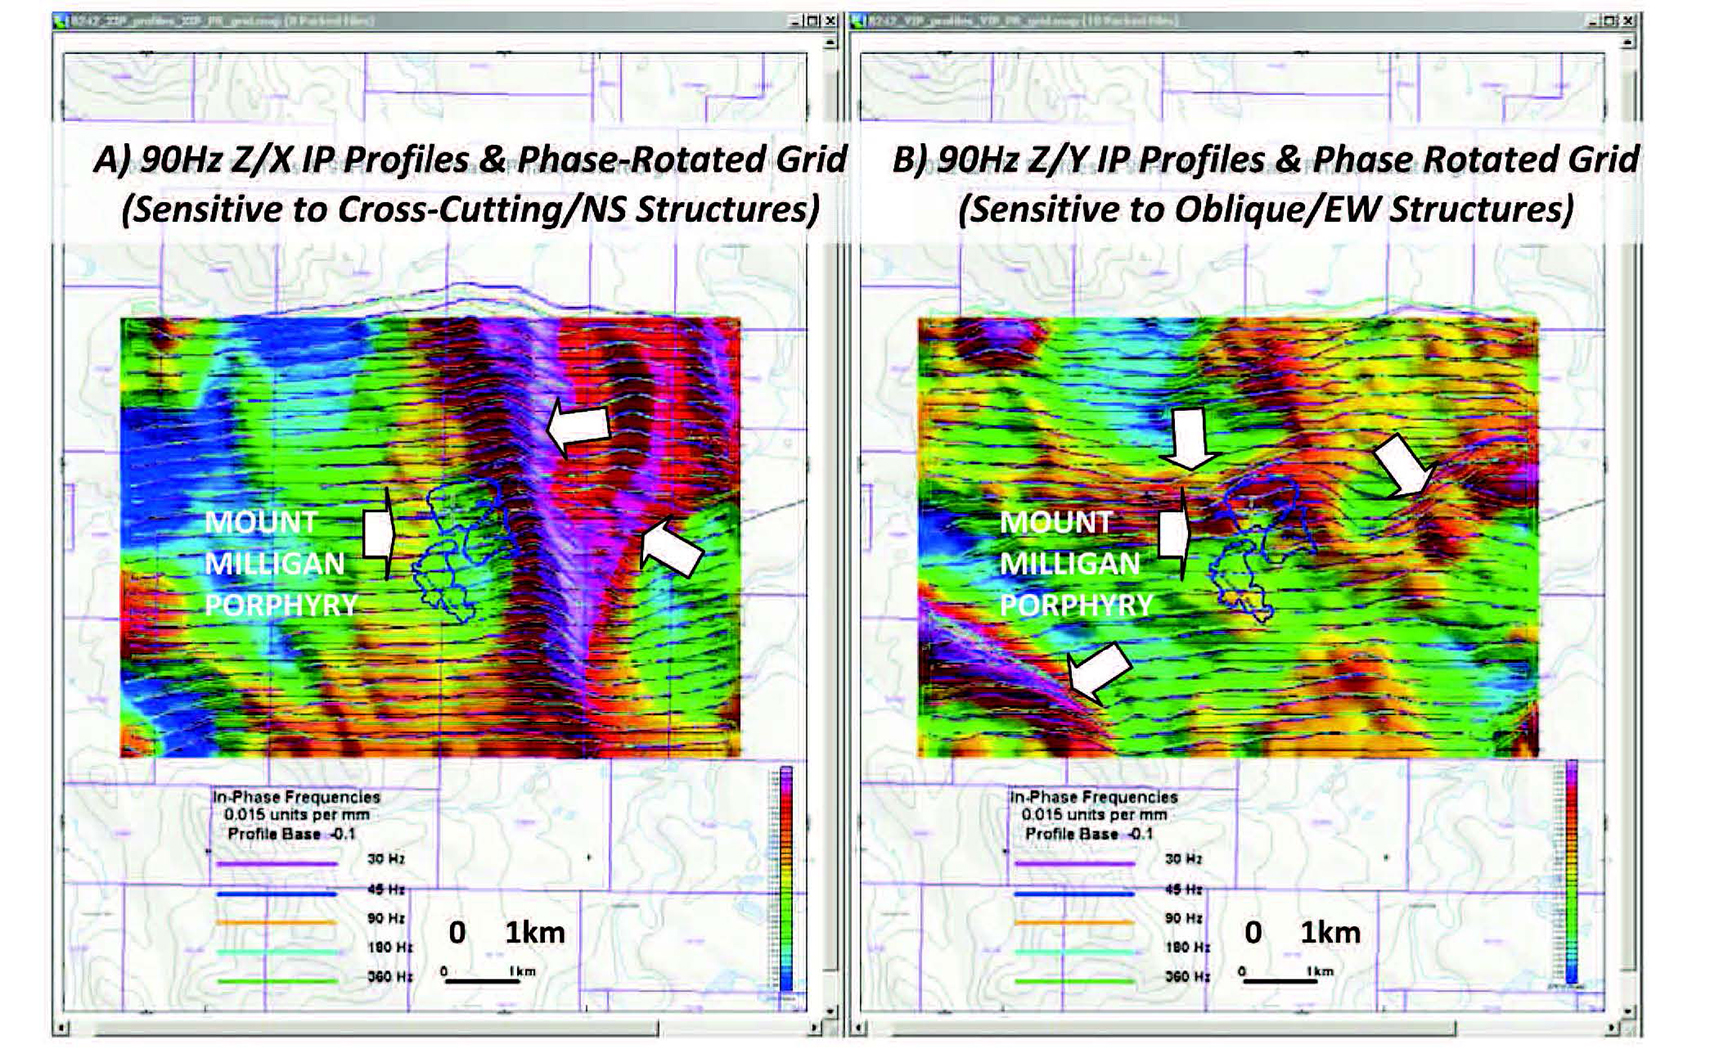
Figure 6: Mt. Milligan ZTEM Test Block: In-Phase Z/X Component Profiles over 90Hz Phase-Rotated (PR) Grid (left) versus Corresponding 90Hz In-Phase Z/Y Profiles and PR Grid (right).
The Resulting PR and the DT images shown in Figures 7 and 8 each also demonstrate the notable differences in the frequency-dependence of the responses, that imply resolved differences in the vertical depth of the defined structures– including a) the main NNW-SSE Great Eastern Fault zone contact response, occurring east of Mt Milligan, that progressively weakens from low to high frequency (Fig. 7b & Fig 8b). This might reflect the fact that this is a major geologic/geoelectric contact that more strongly fault-fractured/altered with greater depth penetration. In contrast, the conductive lineament, which appears to be structurally related and that borders the Mt Milligan porphyries to the north (the Oliver Fault – Fig. 4), progressively weakens in strength with decreasing frequency and increasing depth-penetration. This suggests that it relates more to the near-surface geology and not the deep geologic structure below the Mt. Milligan zones. Also highlighted in these images, particularly the RPR grids in Figure 7, is the subtle circular-like high resistivity anomaly that directly coincides with the Mt. Milligan porphyry and might therefore reflect the potassic alteration halo.
Figure 9 shows the 90 Hz In-Phase DT results (Fig 9a), as well as the corresponding calculated 1ST vertical magnetic gradient (CVG) results (Fig. 9b) and compares them both directly with the structural interpretation, taken from Figure 7-8 and shown as an overlay. Clearly, both the DT and the CVG results both map similar inferred fault-fracture structures, including the main NNW-SSE Great Eastern Fault Zone (GEFZ); however there locus of the ZTEM resistivity lows appears to provide stronger evidence of these structures relative to the magnetic results in Figure 9b. The results showcase the complementary nature of the ZTEM and Magnetic evidence, but also the unique and improved mapping capability that provided with resistivity parameter using ZTEM.
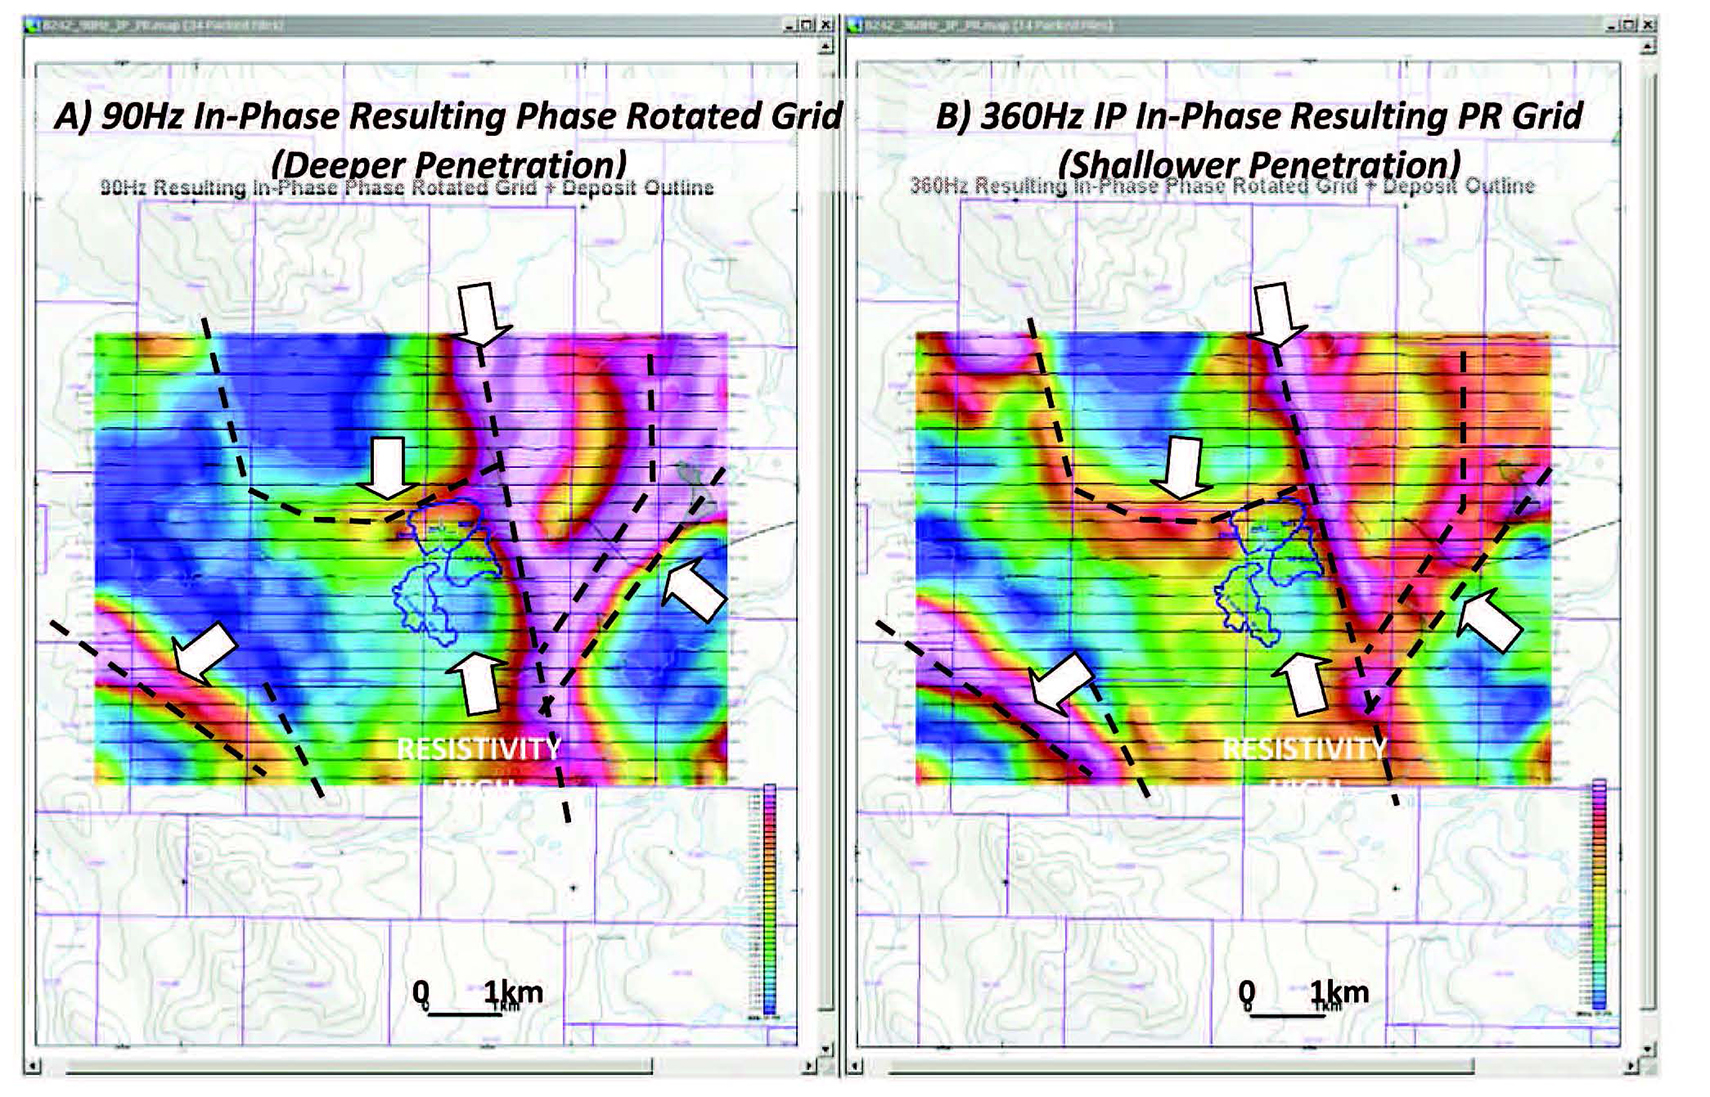
Figure 7: Mt. Milligan Test Block: InPhase Z/Y Component Profiles over 360Hz Total Divergence (DT) Grid (left) versus Corresponding 90Hz InPhase DT Grid (right) and structural interpretation.
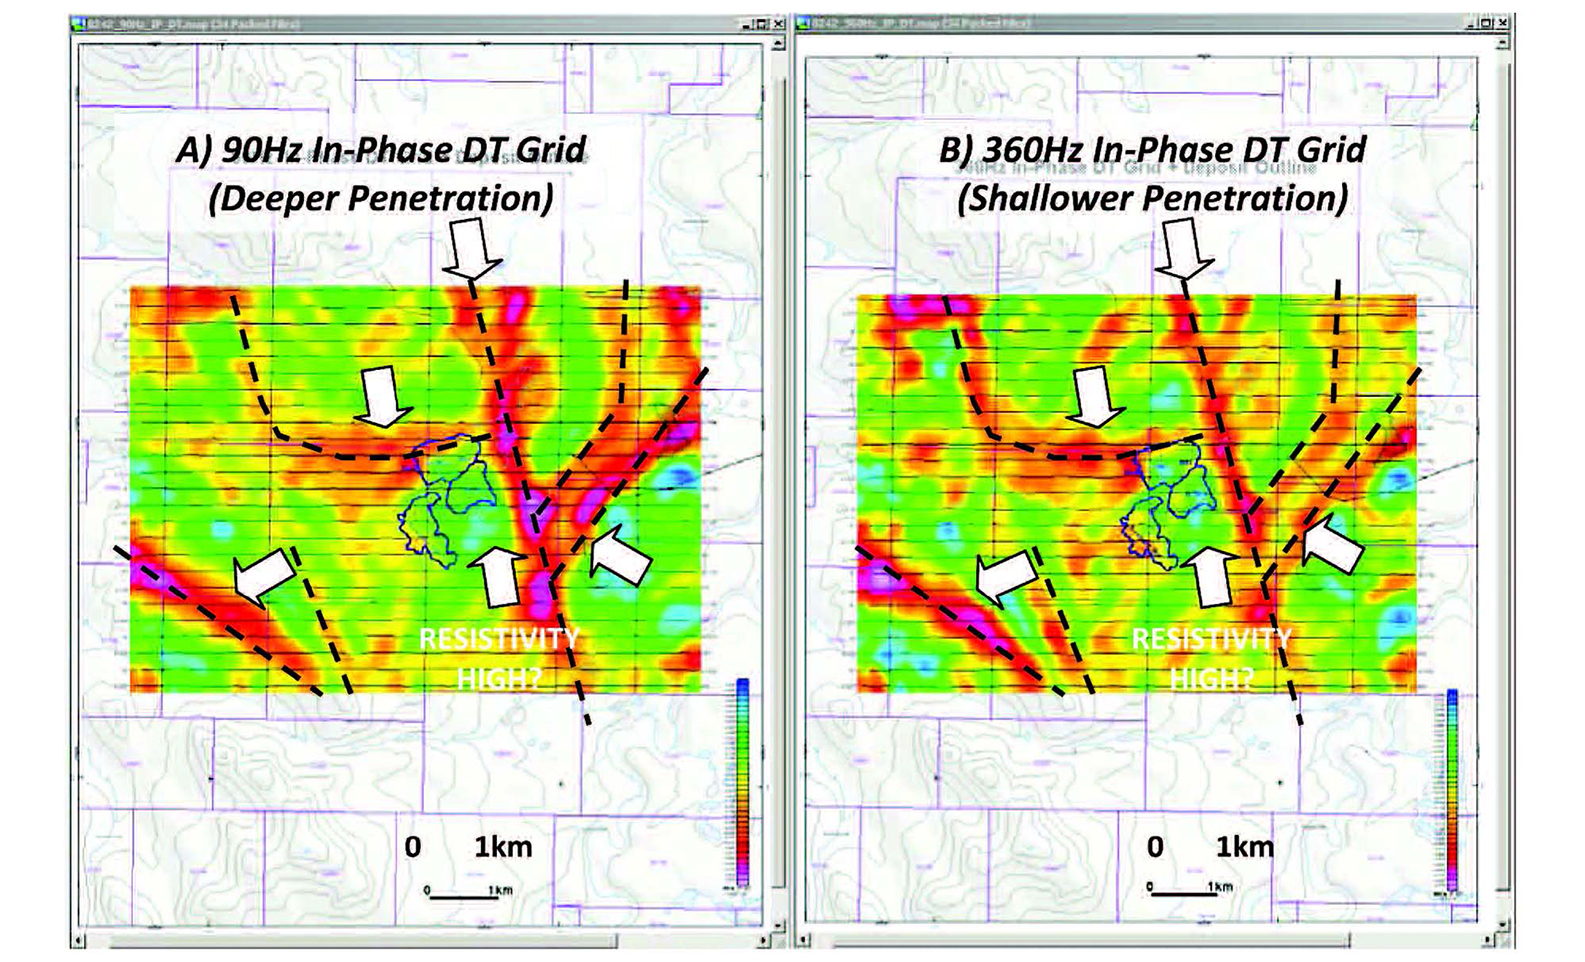
Figure 8: Mt. Milligan Test Block: In¬Phase Z/Y Component Profiles over 360Hz Total Divergence (DT) Grid (left) versus Corresponding 90Hz In¬Phase DT Grid (right).
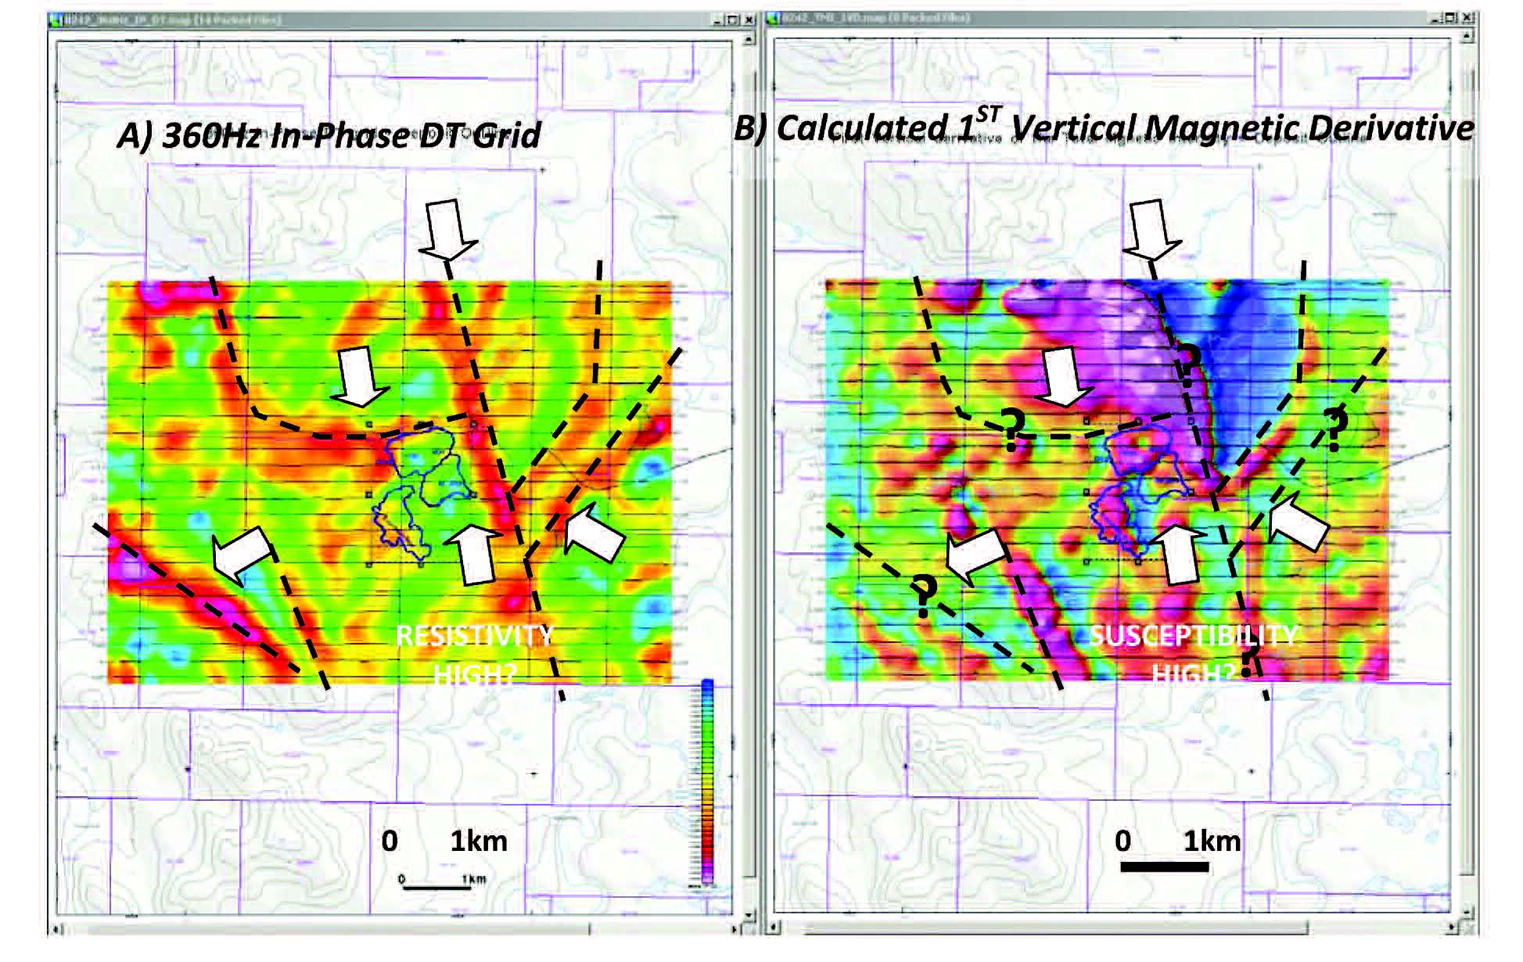
Figure 9: Mt. Milligan Test Block: 360Hz InPhase DT Grid and Interpreted Structures (left) versus Corresponding Calculated 1ST Vertical Magnetic Grid (right).
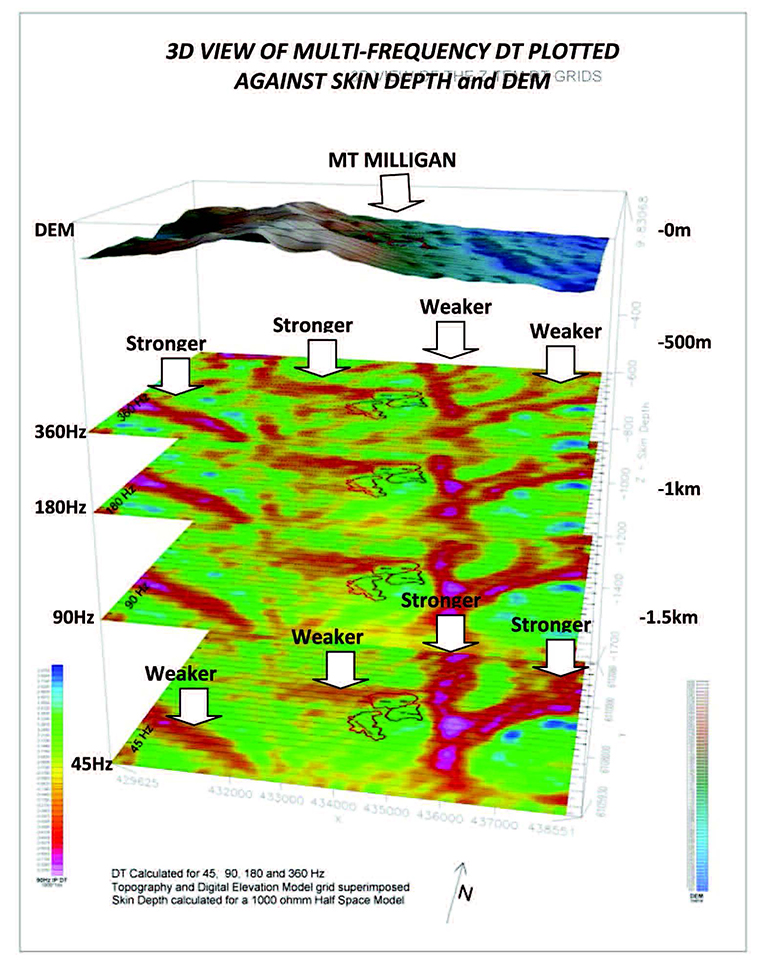
Figure 10: 3D Perspective view of Multi-frequency In-Phase DT’s plotted according to MT skin depth (using 1k ohm-m half-space Earth) and DEM model at ground level.
Figure 10, presents a 3D composite image of the multi frequency DT’s from Mt Milligan plotted at the equivalent MT skin depth, assuming a 1,000 ohm-m average resistivity. As shown, the depth of the DT slices increases with decreasing frequency (360Hz-30Hz) from ~600m to ~1700m.
As shown, this image highlights the frequency dependency of the ZTEM responses obtained, hence possible differences in the depth-range – notably the 2 signatures to the west, that include Mt-Milligan, that weaken with progressive depth and therefore suggests that these are structures are closer to the surface; and the 2 easternmost highlighted features that strengthen with depth which therefore suggests that these are major bedrock fault-fracture zones or contacts.
2D Inversion Analysis
Cross-sectional images of the ZTEM results have been generated using 2D inversion algorithm, in the manner proposed by Perrson et al. (2008) for airborne VLF data. The Zvert2dTM code developed for Geotech Ltd. is based on the Gauss-Newton algorithm of deLugao and Wannamaker (1996) by Prof. Phil Wannamaker at University of Utah. It was specifically modified to take into account the “air” layer between the ZTEM aircoil sensor and the ground level. It is designed to run on a desktop Pentium with 3GHz processor, requiring approximately 20 minutes to execute for a typical ZTEM profile.
The In-line (Z/X) data for a single line profile, taken directly over the center of the Mt Milligan Main Zone Porphyry (MBX), were used to create the 2D inversion image presented in Figure 11. The input data utilized both the In-Phase and Quadrature Phase data from all five measured frequencies. Due to the impractical nature of the>1000 data points from the ZTEM profile, these were undersampled to 90 points in order to perform the calculation and proved effective. An error of 2% was assigned to the data for inversion. A host of 1000 ohmmetres was assumed for the starting model. Despite non-ideality of the data error, a value of nRMS of close to unity (1.0) was achieved in 4-6 iterations, with starting nRMS values of 5-6.
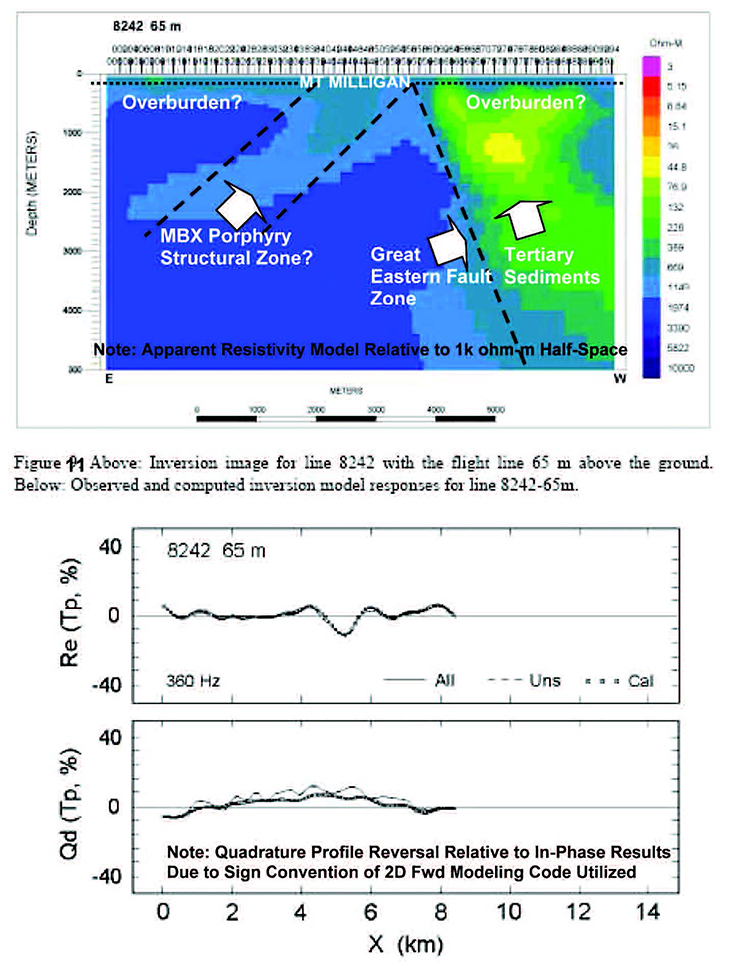
Figure 11: 2D Inversion image with Interpreted Structures and Calculated vs. Observed Z/X profile at 360Hz s for flight line directly over Mt Milligan Deposit, 65m above ground level.
Figure 11 presents the 2D resistivity cross-section obtained from the Mt Milligan line-profile and the corresponding In-Phase and Quadrature profiles showing the measured vs. 2D forward model data fits at 360Hz, for comparison (note that the Quadrature profile is reversed for convention purposes; ref. Wannamaker, 2008). As shown, the data variation is relatively complex with an initial high-frequency minimum in the In-Phase Z/X profile appearing near x = 5.5 km, and then generally positive values of IP (Z/X) developing over therightmost portion of the line. This results in a crudely Y-shaped conductive anomaly in the eastern third of the inversion section with the initial high-frequency anomaly responsible for the upper left limb of the Y (Wannamaker, 2008).
This corresponds to the known Tertiary Sediments that lie east of the older Quesnel-Takla rocks that host the Mt Milligan porphyry, whose boundary is marked by the Great Eastern Fault Zone (GEFZ), which appears to be east-dipping. Based on the ZTEM inversion results, the Tertiary sediments extend quite deeply – to below several km depths. Below a thick conductive overburden cover, a moderate resistivity low feature that is centered on the Mt Milligan MBX porphyry copper zone, in the middle of the profile, appears to dip westward and extends to below several km depths – suggesting a structural zone that resembles the geologic crosssection shown in Figure 4. It appears therefore that the 2D inversion image bears a reasonable resemblance to the known geology.
Conclusions and Recommendations
The ZTEM test results performed over a known copper-gold porphyry deposit in the north-central BC has highlighted the high quality and high resolution structural and alteration mapping, as well as deep penetration capability of the AFMAG data obtained.
The ZTEM results appear to correlate very well with the known geology, in particular the presence of both major and secondary fault structures and geologic contacts. In addition, the ZTEM results appear to indicate differences in the relative source depth and vertical depth-extent of the defined structures that are geologically plausible.. In particular, the ZTEM results point to the presence of a major NNW-SSE-trending conductive fault or contact structure that cross-cuts the survey area and relates the Great Eastern Fault Zone, east of the Mt. Milligan deposits, marking the boundary between the Quesnel Takla group rocks to the west and the younger, down-faulted Tertiary sediments to the east. The Mt. Milligan deposit area itself is marked by a subtle but welldefined circular resistivity high feature, that possibly relates to the potassic alteration halo centred over the porphyry copper zones. As well a weaker, east-westerly low resistivity zone that appears to border the Mt. Milligan porphyries to the north, might relate to the Oliver structural fault zone or possibly the potassicpropylitic alteration boundary which appears to weaken with depth – suggesting that it relates to the nearsurface outcropping geology, rather than a deep feature.
The 2D inversion using the Zvert2d algorithm appears to have been able to compute accurate ZTEM responses in the air and to invert them for reasonable earth resistivity cross section directly over the Main MBX Zone at Mt Milligan. Provided approximate constraints on the host resistivity are available, inversion anomaly positions are more accurate. With poor constraints, trials with a variety of host resistivities are required to judge their dependency. Overall, the Great Eastern Fault Zone and Tertiary sediments are clearly defined, and a possible west-dipping structural zone relating to Mt Milligan porphyry is also suggested that extends to great depth.
We recommend that these ZTEM results be compared with the available geoscientific data, in order to better explain the observed correlations with the known geology. This might include comparisons with any geophysical survey data, in particular, ground EM and possibly also ground magnetotelluric and tipper MT results. We also recommend that additional interpretation of the ZTEM data be attempted, using 2D inversions with geologically-referenced starting models.
References
De Lugao, P.P., and Wannamaker (1996). Calculating the two-dimensional magnetotelluric Jacobian in finite elements using reciprocity, Geophys. J. Int., Vol. 127, pp. 806-810.
Kuzmin, P., Lo, B., and Morrison, E. (2005). Final Report on Modeling, interpretation methods and field trials of an existing prototype AFMAG system, Misc Data Release 167, Ontario Geol. Survey.
Labson, V. F., Becker A., Morrison, H. F., and Conti, U. (1985). Geophysical exploration with audiofrequency natural magnetic fields, Geophysics, Vol. 50, pp. 656-664.
Lo, B., Legault, J.M., Kuzmin, P. (2008). Z-TEM (Airborne AFMAG) tests over unconformity uranium deposits, extended abstract submitted to 20TH ASEG International Geophysical Conference & Exhibition, Adelaide, AU.
Persson, L., Erlström, M., Bastani, M., and Pederson, L. (2008). Airborne VLF measurements over the Island of Gotland, Sweden, paper presented at AEM2008 – 5th International Conference on Airborne Electromagnetics Haikko Manor, Finland, May 2008.
Terrane Metals Corp. (2008), Technical Report – Feasibility Mt. Milligan Property, Northern BC, prepared by Wardrop (Vancouver, BC), Document No. 0652590200-REP-R0015-01, 384 pp.
Wannamaker, P.E. (2008). Two-dimensional inversion of ZTEM data: Synthetic model study & test profile images, technical report by Emblem Geophysical Inc. for Geotech Ltd., Dec-2008, 25 pp.
Ward, S. H. (1959). AFMAG – Airborne and Ground: Geophysics, Vol. 24, pp. 761-787. info@geotech.