Presented at 13th SAGA biennial conference and exhibition
For a PDF of this paper click here
Abstract
Helicopter VTEM™ active source, ZTEM™ AFMAG passive source EM and aeromagnetic survey results are compared over the Nuqrah Sedex massive sulphide deposit in Western Arabian Shield of KSA. Field data and 1D-2D- inversions are used to show that all surveys map major controlling structures that host the Nuqrah deposits. VTEM directly detects more massive sulphide mineralized vent portions of Sedex orebodies; whereas ZTEM likely defining larger, less conductive and weakly mineralized distal portions of Sedex system. ZTEM also maps possible conductive down-dip extension of Nuqrah South Sedex below 750m depths.
Key words: VTEM, ZTEM, AFMAG, Aeromagnetic, Sedex
Introduction
Mineral exploration in the Arabian Shield region of the western Kingdom of Saudi Arabia (KSA) has identified thousands of mineral occurrences and has included airborne geophysics, primarily regional magnetics and radiometrics (Figure 1). In late Fall-Winter 2011, as part of a larger survey campaign in the western Arabian Shield, helicopter electromagnetic survey tests were flown for comparison purposes over the 1.4Mt Nuqrah Sedex (sedimentary exhalative; Ford et al., 2007) copper-lead-zinc-gold massive sulphide deposit, using the VTEM (versatile time-domain electromagnetic; Witherly et al., 2004) and ZTEM (z-axis tipper electromagnetic; Lo and Zang, 2008) systems in order to determine their airborne geophysical signatures.
General Geology
The Arabian Shield (Figure 1) is primarily made up of Precambrian rocks of mainly Neoproterozoic age (560-850 Ma). In addition to the better known gold deposits such as Mahd Ad Dahab, numerous base metal VMS and Sedex type metal sulphide deposits are also found throughout west-central Saudi Arabia, such as Nuqrah (Roberts et al., 1975; Ma’aden, 2011), which is the focus of this study.
The Nuqrah Sedex cu-pb-zn-au deposit, deposit comprises two mineralized bodies (North and South) that are north-striking and 4km apart (Figure 2), each marked by a gossan. At Nuqrah North the mineralization is in graphitic-chloritic volcanic tuffs and dolomitic marble; the mineralized bodies are pod-like and parallel bedding.
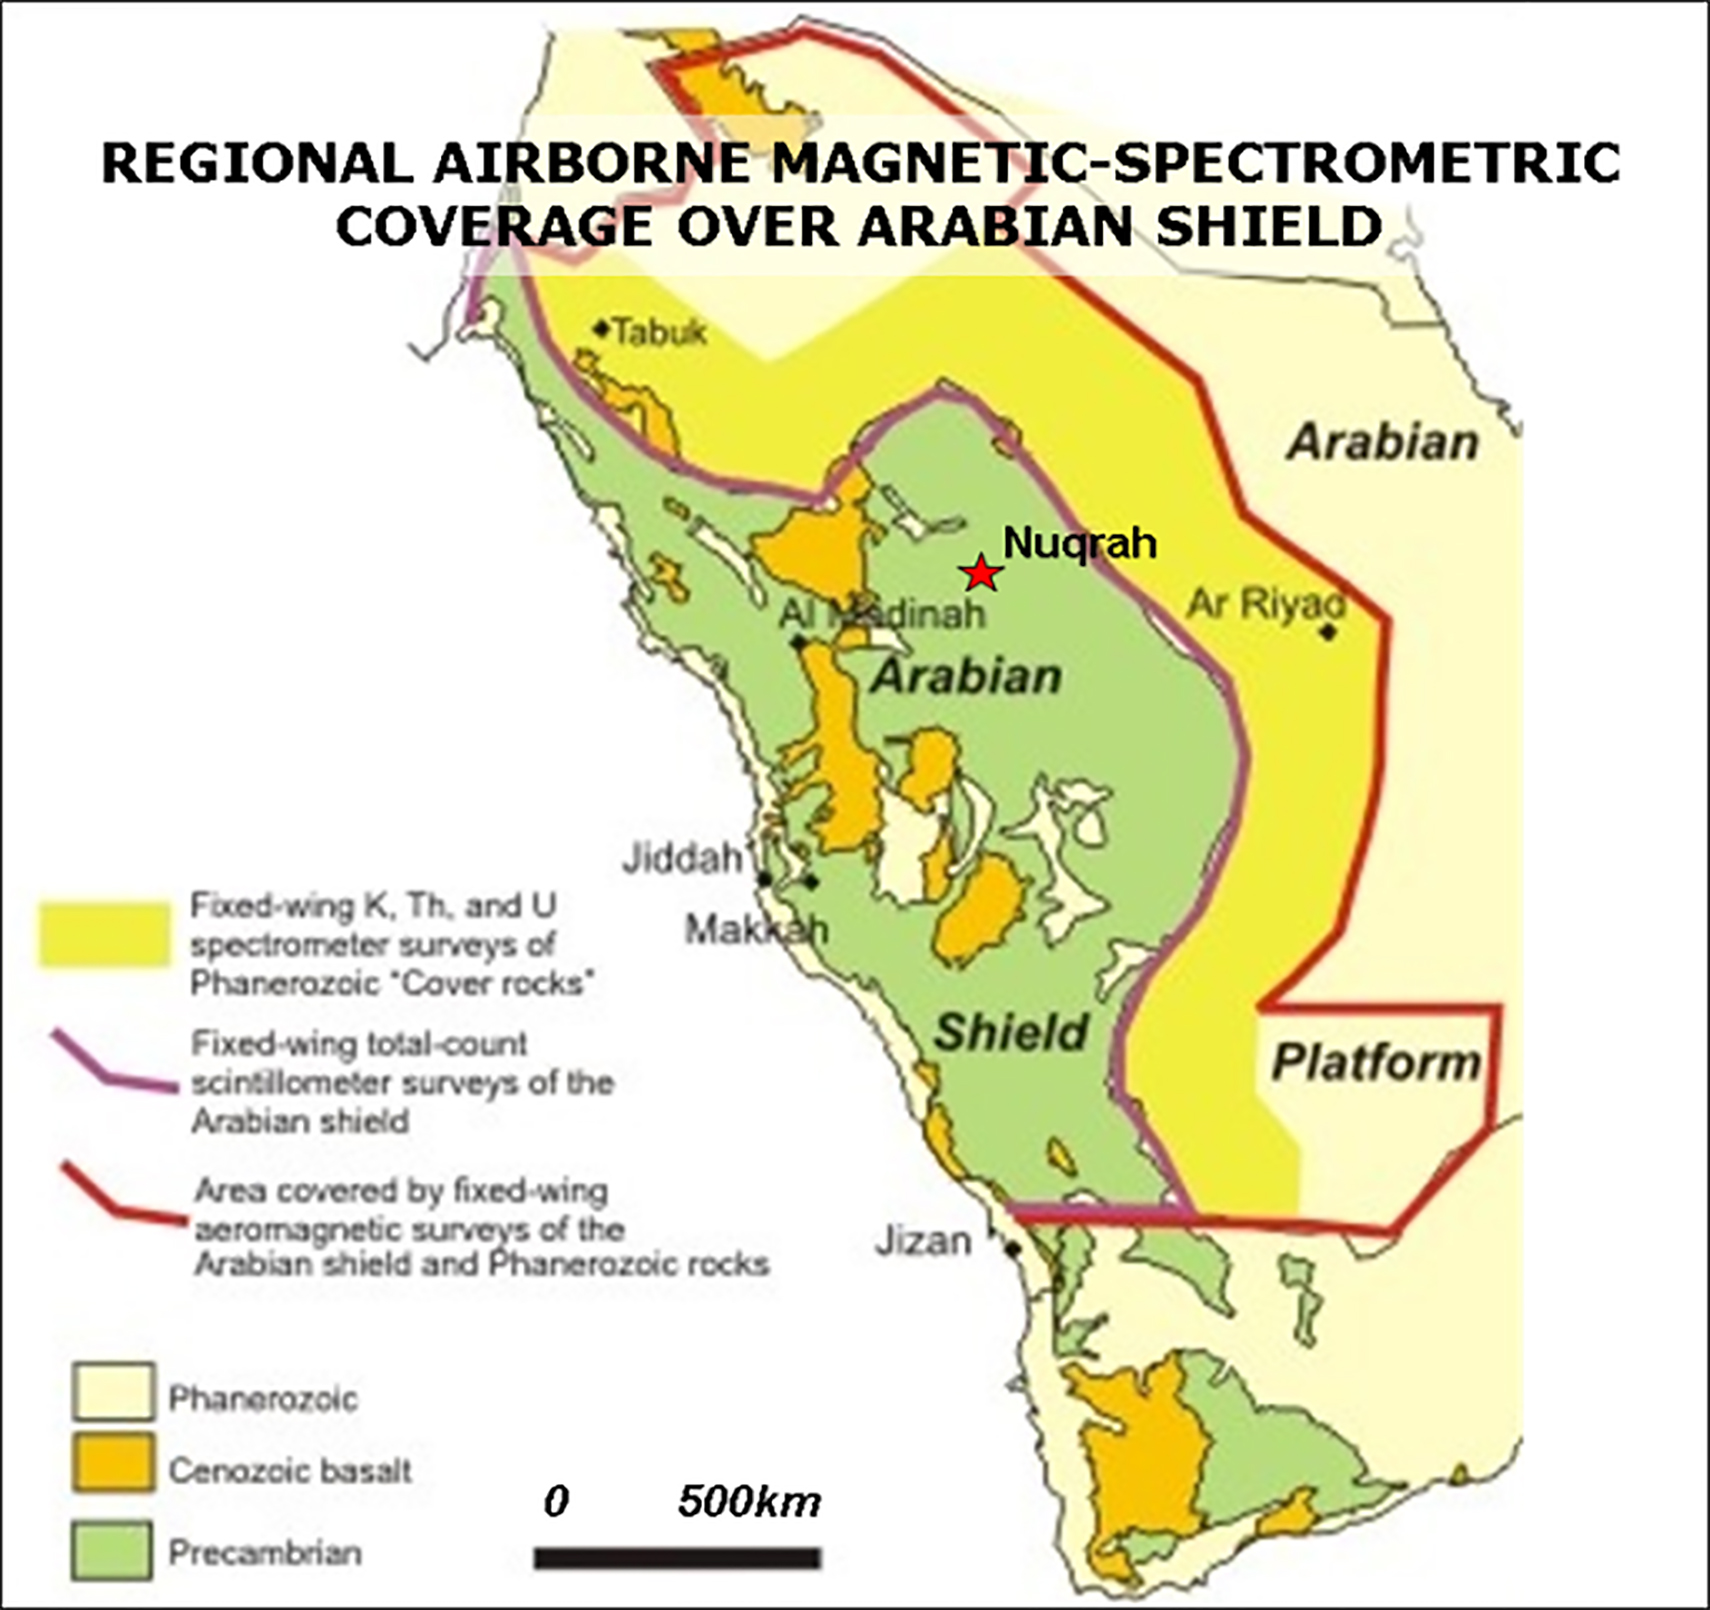
Figure 1: Regional airborne survey coverage of KSA in 2008, showing Precambrian Arabian Shield and Nuqrah deposit location (after www.sga.com.sa).
At Nuqrah South the beds strike in general N20°E and dip 50°NW, and the mineralization is in lenticular pods along the bedding between dolomitic marble and diabase. Ore minerals consist primarily of pyrite, sphalerite, chalcopyrite, galena, arsenopyrite and pyrrhotite. The 0.4Mt Nuqrah North deposit averages 2.5 g/t Au, 332 g/t Ag, 0.75% Cu, 1.22% Pb and 6.0% Zn; Nuqrah South 1.0Mt deposit averages 4.3 g/t Au, 220 g/t Ag, 0.82% Cu, 1.83% Pb and 5.6% Zn (Roberts et al., 1975).
Figure 2a presents the property geology below the Nuqrah survey area and shows the dominant NE-trending geologic contacts and paralleling thrust-fault control that are in turn offset along NW-trending displacement faults. Nuqrah North and Nuqrah South are both situated near the junctions of these cross-cutting geologic features. Figure 2b presents the VTEM and ZTEM line locations, and showing how the geology follows the gentle to moderate terrain at Nuqrah.
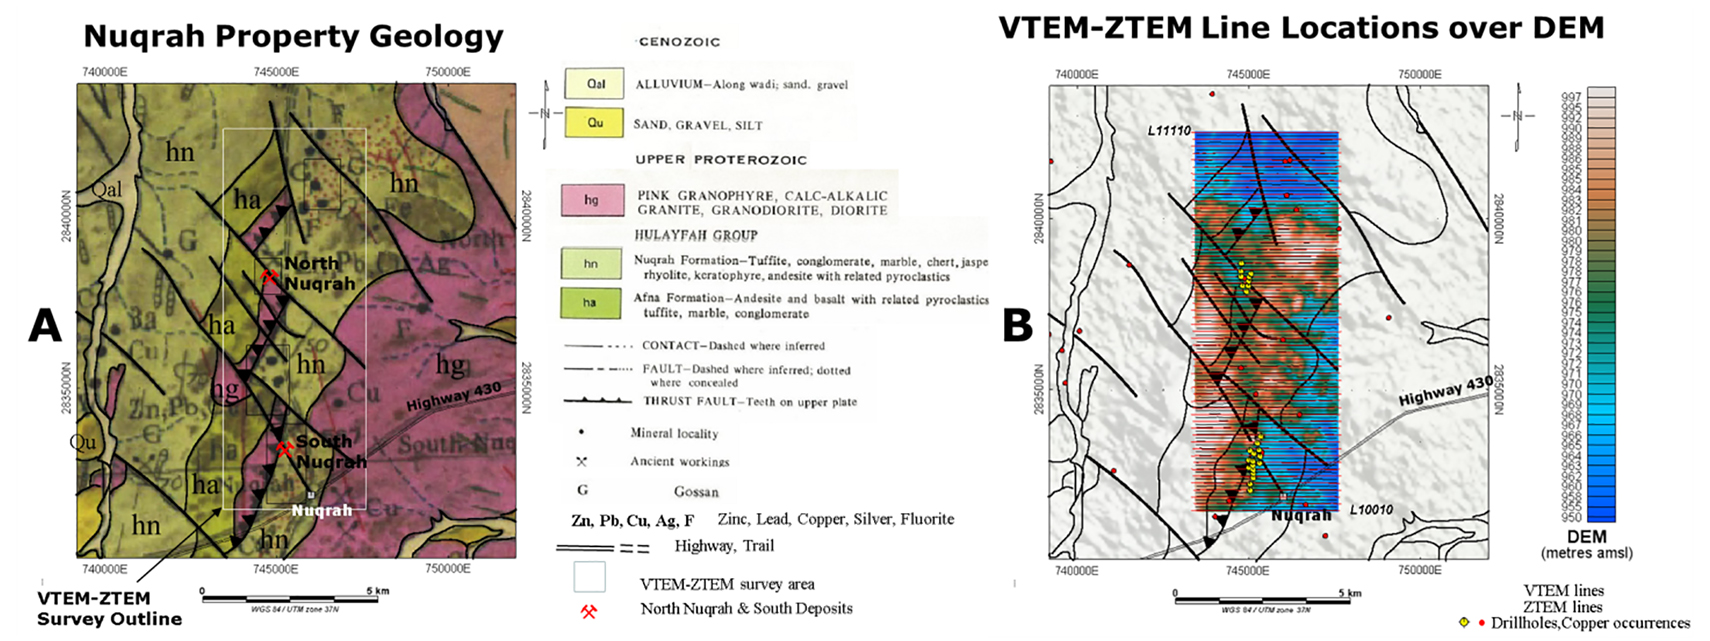
Figure 2: a) Nuqrah property geology (modified after Delfour, 1977), and b) ZTEM-VTEM survey lines over VTEM digital elevation model, with geologic overlay, known drillholes and copper occurrences (courtesy Ma’aden Gold, Dec-2011).
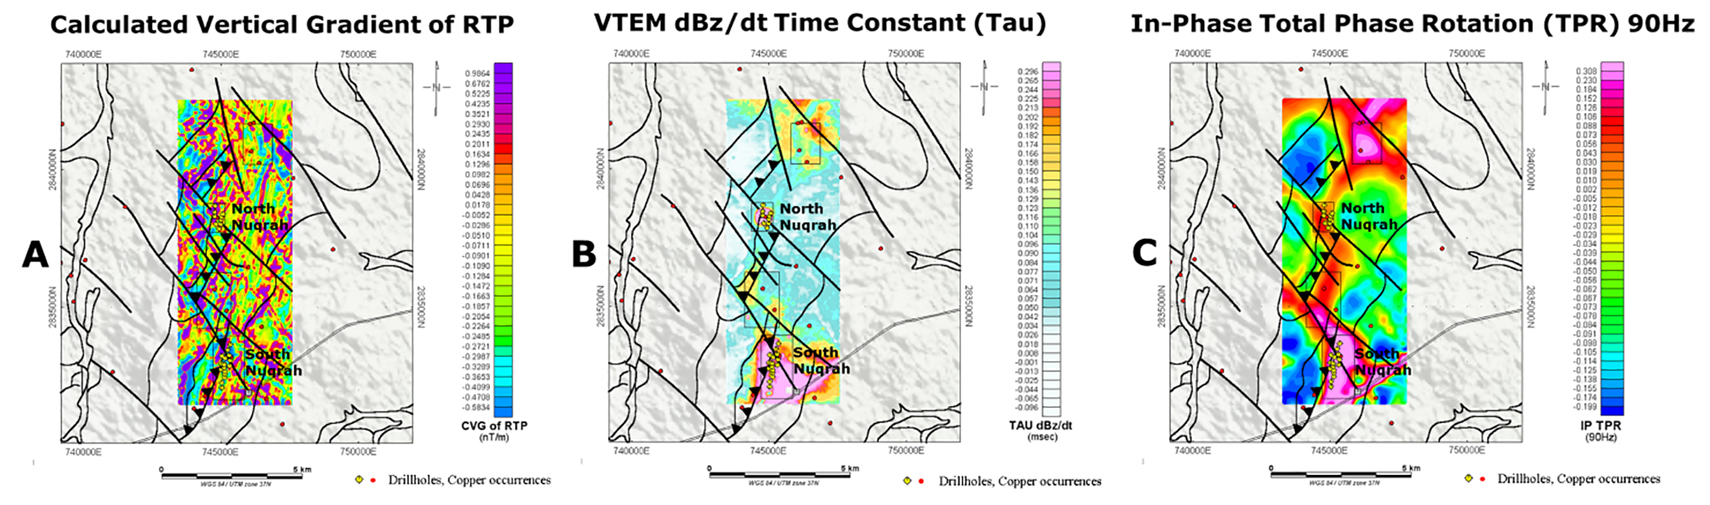
Figure 3: a) Calculated vertical gradient (CVG) of magnetic RTP, b) VTEM dBz/dt decay time-constant (TAU), and c) ZTEM Total Phase Rotation (TPR) for In-phase 90Hz tipper, with overlays according to Figure 2.
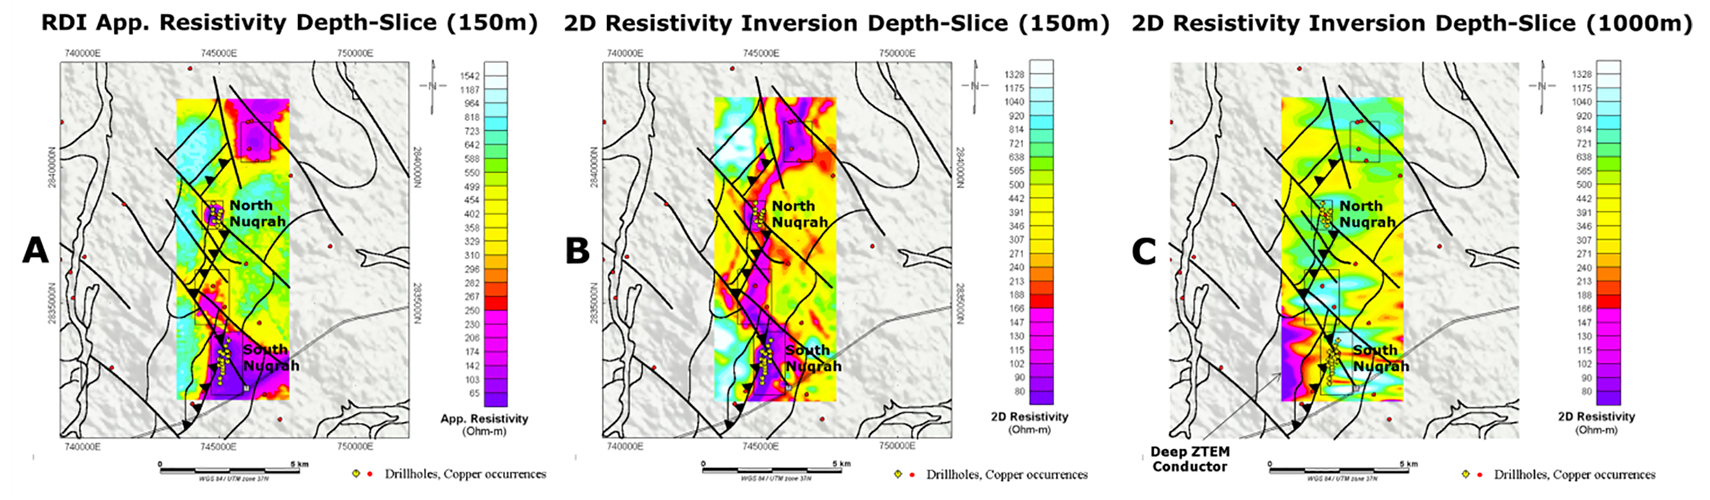
Figure 4: a) VTEM resistivity depth-slice at 150m from RDI imaging, b) ZTEM resistivity depth-slice at 150m from 2D inversion, and c) 1000m depth-slice, with overlays according to Figure 2.
VTEM-ZTEM Survey Results
The VTEM survey coverage at Nuqrah consisted of Z and X component, off-time dB/dt and B-field measurements, and aeromagnetics using a caesium magnetometer. A total of 456 line-km were acquired along 111 lines of approx. 4.1 km length and spaced at 100 m (Figure 2b). The ZTEM overlapping coverage consisted of in-line (Tzx) and cross-line (Tzy) tipper AFMAG, (Ward, 1959; Labson et al., 1985) and caesium aeromagnetic data. A total 243 km of ZTEM were flown along 56 lines, averaging ~4.3 km in length, and at 200 m line-spacing (i.e., ZTEM flown over every 2ND alternating line of VTEM). This provided sufficient resolution and also has allowed for both survey results to be more readily compared over Nuqrah.
Figure 3a presents the magnetic results obtained from the VTEM survey, with the calculated vertical gradient (CVG) of the pole-reduced (RTP) total magnetic intensity clearly reflecting these cross-cutting NE geologic and NW structural trends, but not highlighting the Nuqrah deposits in particular. Figure 3b presents the VTEM survey vertical coil (z) dB/dt EM decay time-constant (TAU) results that highlight the cross-cutting NE and NW faulted geology as well as smaller, more discrete higher conductance anomalies over the Nuqrah North and South deposits that are the strongest observed.
Figure 3c presents the Total Phase Rotated (TPR) ZTEM tipper AFMAG results that convert the tipper cross-over responses into peaks using phase-rotation (Lo and Zang, 2008; Legault et al., 2012a). All indicate generally lower resistivities along the main thrust-faulted NE-trending contacts, regionally, as well as the more weakly conductive NW-trending fault offsets that were also defined in the aeromagnetics and, to a lesser extent, the VTEM data. Although shown to be conductive, neither of the Nuqrah deposits stands out as clear-cut anomalies, regionally, in these ZTEM results.
VTEM-ZTEM Interpretation
The VTEM survey results were interpreted using an in-house pseudo-2D resistivity depth-imaging (RDI) code, according to the method described by Meju (1998), as well as Maxwell 2.5D multiple plate modeling (EMIT Technologies Pty. Ltd, Midland, AU). The ZTEM survey results were interpreted using the Av2Dtopo inversion code (Legault et al., 2012b) that was adapted for the ZTEM airborne AFMAG system from standard 2d MT inversion code (c.f., Legault et al., 2009).
Figure 4 presents the resistivity-depth slices obtained from RDI imaging of the VTEM dBz/dt results 150m below the surface, with approximately 350m being the nominal estimated depth of investigation for the VTEM survey. The enhanced structural fabric displayed in these RDI level plans more closely resemble the ZTEM DT results shown previously in Figure 3c and the ZTEM 2d inversion level plan in Figure 4b. The ZTEM inversions display resistivities that are generally quite comparable to VTEM, except for the shallowest depths that are better resolved in the VTEM results. However, the ZTEM images extend more deeply than for the VTEM with the nominal ZTEM depth of investigation estimated to exceed 1.5km. Indeed, a deep (>750m) conductive zone is defined west of Nuqrah South in Figure 4c.
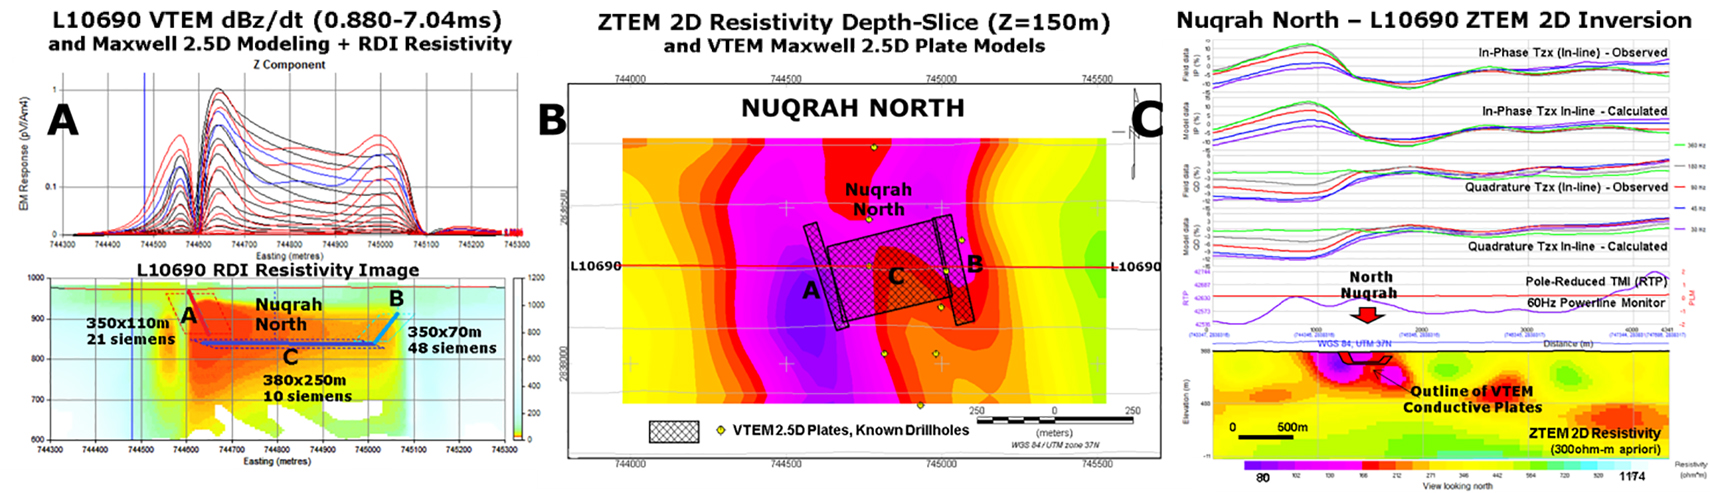
Figure 5: VTEM and ZTEM Inversion Modeling at Nuqrah North: a) L10690 cross-section showing VTEM mid to late channel dBz/dt profiles (observed-black, modeled-red +blue), RDI resistivity depth-section and Maxwell plate models; b) ZTEM resistivity depth-slice from 2D inversions, with VTEM plate models overlain, and c) L10690 cross-section showing ZTEM Tzx (in-line) observed vs. calculated profiles, 2D resistivity section and outline of VTEM conductor plate models.
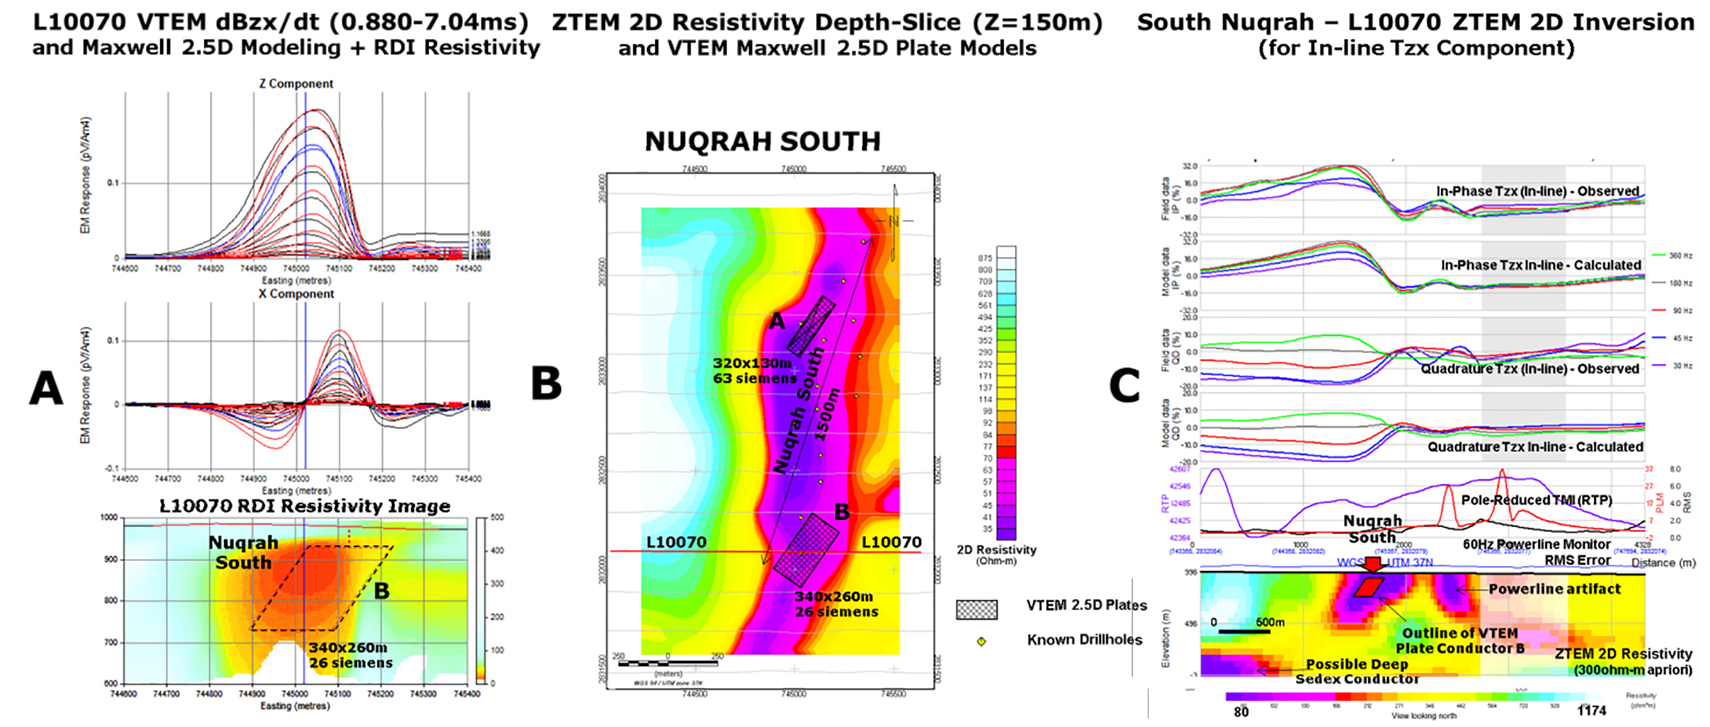
Figure 6: VTEM Inversion Modeling for L10070 at Nuqrah South: a) EW Cross-section showing mid to late channel dBz/dt profiles (observed-black, modeled-red +blue), RDI resistivity depth-section and Maxwell plate models; b) ZTEM resistivity depth-slice from 2D inversions, with VTEM plate models overlain, and c) Cross-section showing ZTEM Tzx (in-line) observed vs. calculated profiles, 2D resistivity section and outlines of VTEM plate models, also showing the deeper ZTEM conductive zone west of the Nuqrah South sedex deposit.
Figures 5-6 compare the VTEM RDI resistivity-depth section and Maxwell 2.5D plate model inversion results with ZTEM 2D inversion results over the respective North and South Nuqrah deposits. The deposit outlines are not known to the authors, but the known drill holes approximate their locations. VTEM results indicate that Nuqrah North consists of multiple plate-like conductive bodies (>10-50 siemens) that occupy a 350m NS by 400m EW area that is centred on the known diamond drilling. Nuqrah South hosts a least two large (>150x350m) plate-like, higher conductance (>25-60 siemens) bodies situated at the north and south ends of its >1.5km long apparent strike extent, based on ddh results. As shown, the ZTEM conductive anomalies all coincide very well, with the VTEM plate conductors in cross-section.
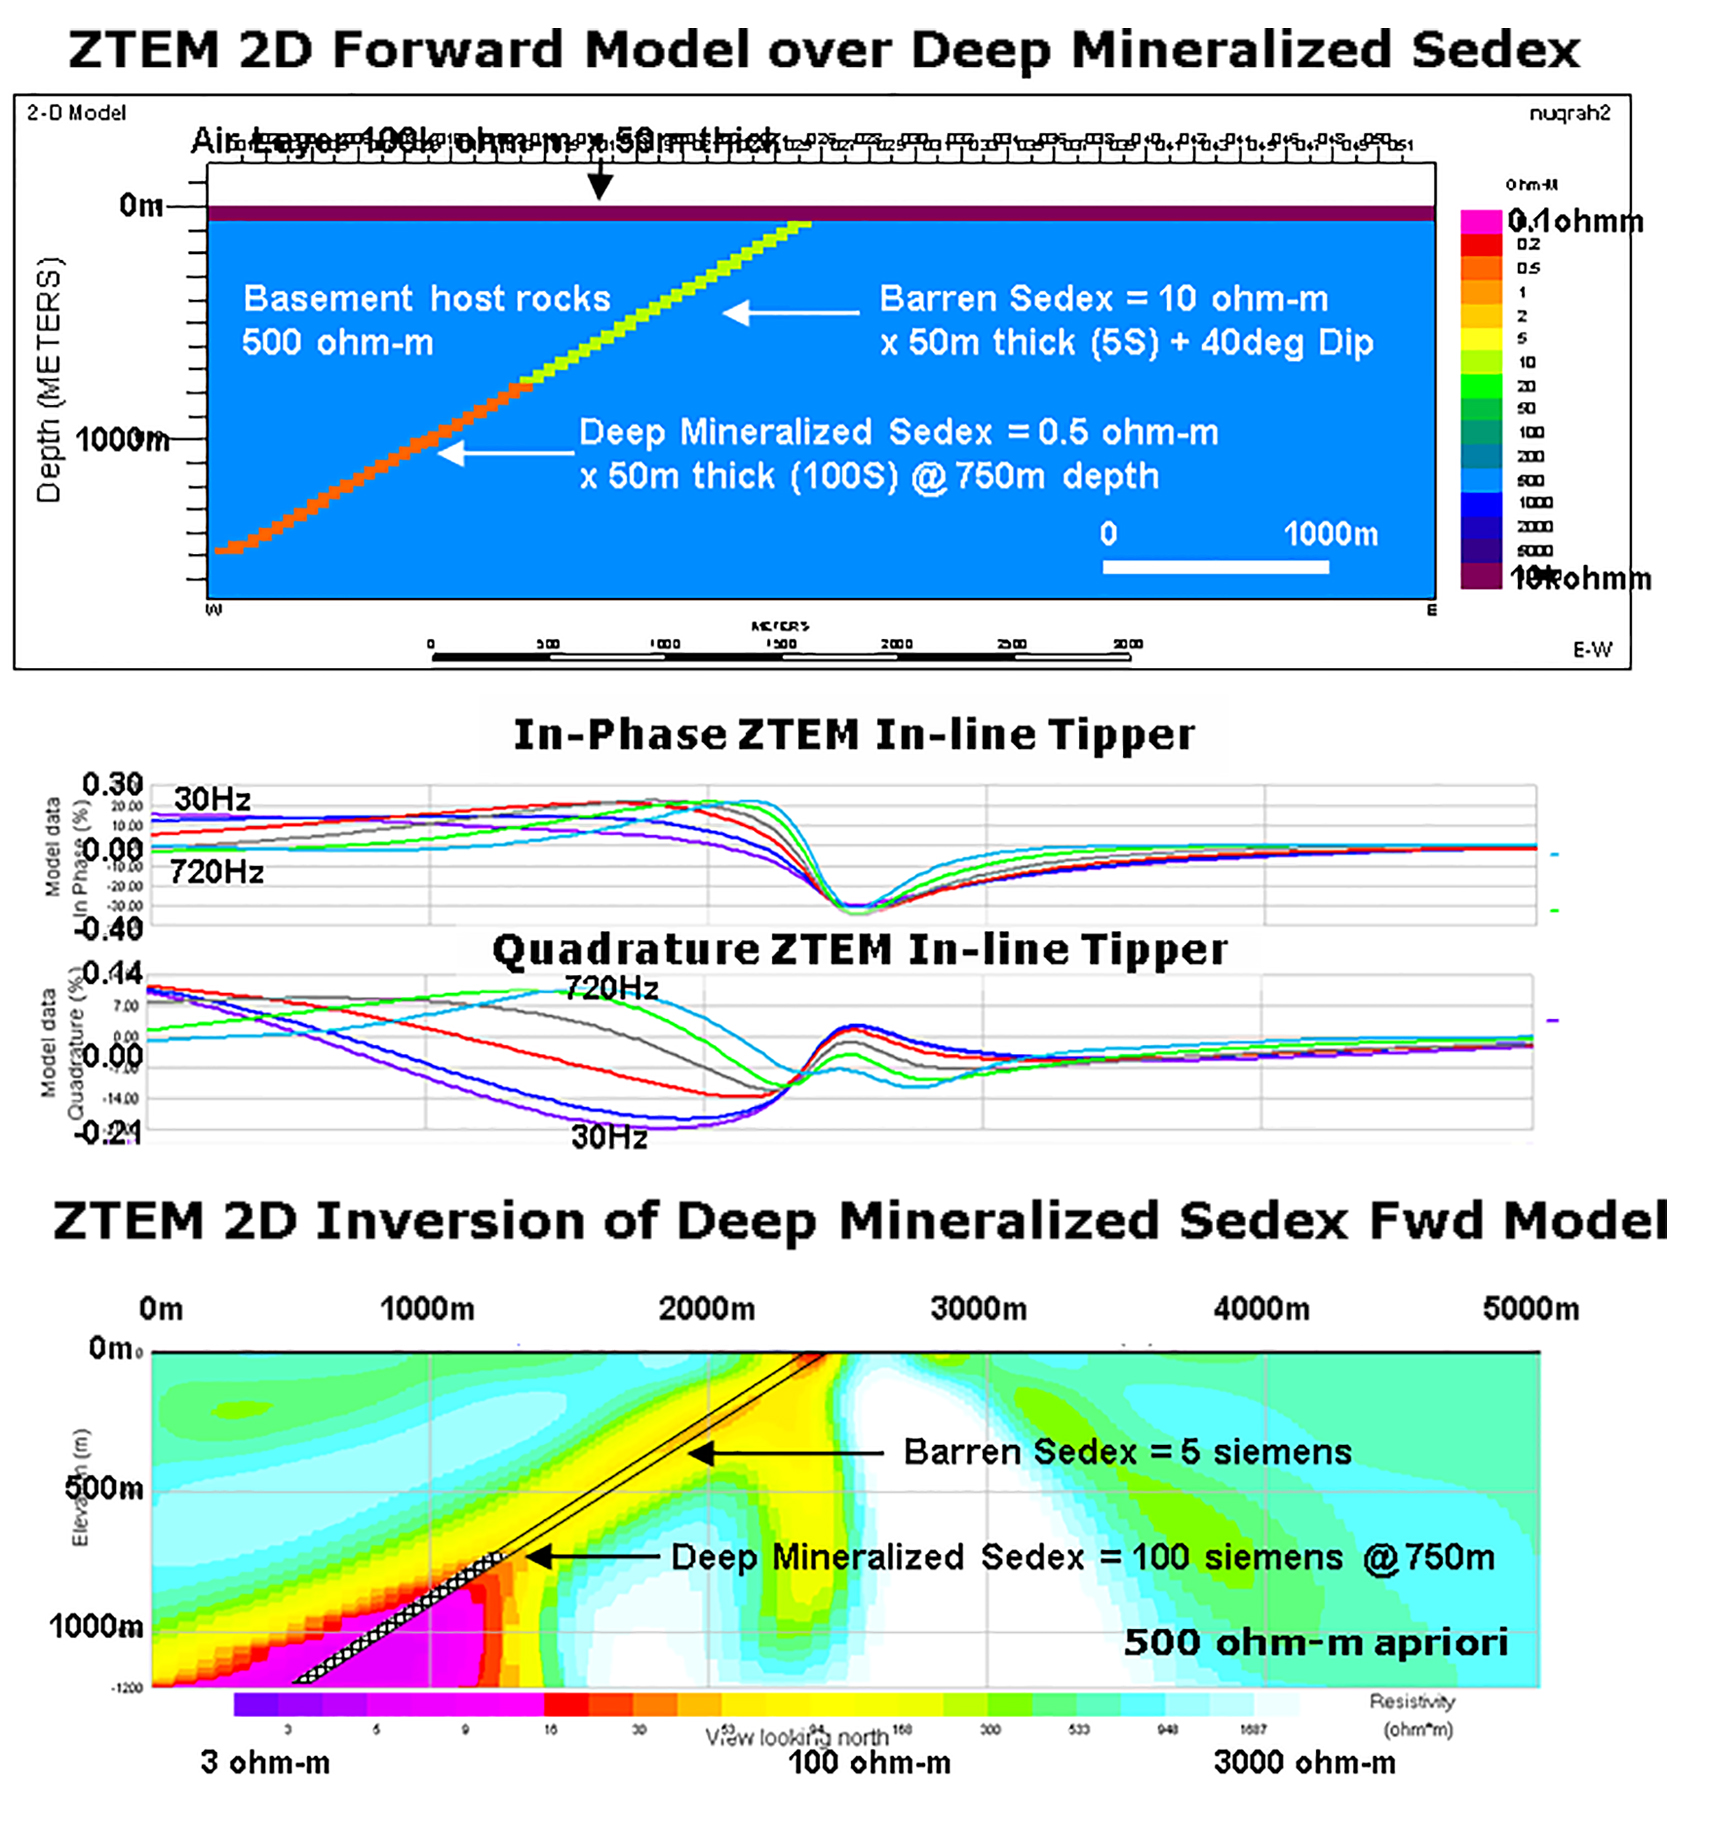
Figure 7: 2D synthetic model and inversion for buried dipping Sedex massive sulphide conductor at 750m depth.
In plan, the ZTEM 2D inversion results indicate much longer strike-continuity than VTEM but otherwise matches the drilling. No further down-dip extensions of Nuqrah North below 250-350m depths are indicated in the ZTEM 2D inversion results However, a deeper ZTEM conductor, highlighted in Figure 6c lying at 750m-1km depth, was defined in all 16 lines of 2d inversion west of Nuqrah South. 2D synthetic ZTEM modeling predicts the detectability of a massive sulphide conductor below 750m (Figure 7). This unexplained feature might potentially represent a deep extension of the Sedex orebody (or, alternatively, a more clay-altered thrust fault) that remains open to the west and south.
Conclusion
VTEM has been able to characterize the regional geologic and localized high conductivity signatures associated with Nuqrah North and Nuqrah South Sedex deposits, as well as new, unexplained targets of low to moderate conductance to +350m depths. Both the VTEM and ZTEM survey data indicate that the major controlling structures that host Nuqrah North and South also remain open to the northeast and south of the survey area. VTEM and ZTEM anomalies generally coincide well with the North and South Nuqrah deposits, with the VTEM likely defining the smaller, shorter strike-length and more copper-rich massive sulphide mineralized vent portions of the Sedex orebodies; whereas the ZTEM possibly defines the larger, pb-zn rich/copper-poor as well as the more clay-altered and less conductive distal portions of the Sedex system. More importantly, the ZTEM appears to be mapping deeper conductive features, below the 350m depth limit of VTEM, including what potentially represents the western down-dip extension of Nuqrah South deposit at 750m depths.
References
Delfour, J., 1977, Geology of the Nuqrah quadrangle, 25 E, Kingdom of Saudi Arabia, Ministry of Petroleum and Mineral Resources, Saudi Arabian Directorate General of Mineral Resources, Geoscience map, GM-28, scale 1:250,000.
Ford, K., Keating, P. and Thomas, M.D., 2007, Mineral Deposits of Canada – Overview of geophysical signatures associated with Canadian ore deposits. In “Mineral Resources of Canada: A Synthesis of Major Deposit-types, District Metallogeny, the Evolution of Geological Provinces, and Exploration Methods”, Geological Survey of Canada (GSC) and the Mineral Deposits Division (MDD) of the Geological Association of Canada, 939-969.
Labson, V. F., Becker, A., Morrison, H.F., and Conti, U., 1985. Geophysical exploration with audio-frequency natural magnetic fields, Geophysics, 50, 656–664.
Legault, J.M., Kumar, H., Milicevic, B., and Wannamaker, P., 2009, ZTEM tipper AFMAG and 2D Inversion results over an unconformity uranium target in northern Saskatchewan, SEG Expanded Abstracts, 28, 1277-1281.
Legault, J.M., Wilson, G., Gribenko, A., Zhdanov, M. S., Zhao, S., and Fisk, K., 2012a, An overview of the ZTEM and AirMt airborne electromagnetic systems – A case study from the Nebo-Babel Ni-Cu-PGE deposit, West Musgrave, Western Australia, Preview, 158, 26-32.
Legault, J.M., Zhao, S., and Fitch, R., 2012b, ZTEM airborne AFMAG survey results over low sulphidation epithermal gold-silver vein systems at Gold Springs, south eastern Nevada, 22ND International Geophysical Conference and Exhibition, Brisbane, ASEG Extended Abstracts, 4 p.
Lo, B., and Zang, M., 2008, Numerical modeling of Z-TEM (airborne AFMAG) responses to guide exploration strategies, SEG Expanded Abstracts, 27, 1098-1101.
Ma’aden, 2011, Ma’aden Saudi Arabian Mining Company, Annual Report, 123 p.
Meju, M.A, 1998, Short Note: A simple method of transient electromagnetic data analysis, Geophysics, 63, 405-410.
Roberts, R.J., Greenwood, W.R., Worl, R.G., Dodge, F.C.W., and Killsgaard, T.H., 1975. Mineral deposits in western Saudi Arabia, U.S. Geological Survey open-file report 75-654, 64 p.
Ward, S. H., 1959, AFMAG – Airborne and Ground: Geophysics, 24, 761-787.
Witherly, K., Irvine, R., and Morrison, E.B., 2004, The Geotech VTEM time domain helicopter EM system: SEG Expanded Abstracts, 23, 1217-122.