For a PDF of this paper click here
Abstract/Summary
Over the last two decades, Electromagnetic (EM) methods have made unprecedented progress in acquisition and signal processing due to the advent of devices with larger storage capacity and lower instrumental noise as well as the improvement of signal processing algorithms. This is turn has greatly enhanced precision on EM data and bettered signal-to-noise ratio (S/N). Today, techniques like Controlled-Source EM (CSEM) and Magnetotellurics (MT) have gained popularity and credibility as non-seismic techniques in Oil and Gas exploration, both offshore and onshore. The suitability of EM methods to detect potential economic reservoirs lies in the fact that highly oil-saturated sedimentary units become exceedingly resistive spots embedded in usually conductive sedimentary settings. Many pilot geophysical surveys have used EM methods to effectively detect these “bright spots” or resistive markers associated with different petroleum systems worldwide.
In spite of its unique advantages and successful results, only marine EM has made it into mainstream of exploration programs in Oil and Gas; whereas onshore 3D-MT surveys remain costly and logistically cumbersome, especially in remote areas. However, there has been increased interest in continental oil reservoirs and in areas where conventional seismics face serious challenges or are prohibitively expensive due to environmental sensitivity, poor road network, or unfavorable geological structures (e.g dispersive geological settings, steep geological structures).
In parallel, Airborne EM (AEM) has equally made breakthrough in both active and passive EM techniques. The inclusion of precise GPS antennas and highly sensitive magnetic coils have created a wealth of applications and system developments for AEM in natural resource exploration that was only possible by ground EM surveys. Amongst the most recent and proven developments is ZTEM, which has grown into Mining industry and is fully compatible with ground MT. This latter revitalizes the chances for further progress of inland EM application in Oil and Gas surveys. With this in mind, two applications of ZTEM in cooperation with MT are highlighted: (1) Continental Sub-Basalt Basins, and (2) Foothill basins. In these two settings, MT has made important contributions.
ZTEM
ZTEM is a unique passive AEM System engineered and manufactured by Geotech Ltd with > 200.000 line kilometers flown worldwide over the course of the last 8 years, since it was inserted into commercial EM services. ZTEM consists of three magnetic sensors that record vertical magnetic field (Bz) at a moving sensor towed from a helicopter, and two perpendicularly horizontal components of the magnetic field (Bx and By) at a fixed ground station, a.k.a Base Station (Fig. 1). Then it employs modern signal processing algorithms similar to those used in Magnetotellurics (MT) to compute the Magnetic Tipper tensor (Tzx, Tzy). The Tipper is calculated in the frequency domain using (Labson, 1985):
Bz=TzxBx+TzyBy
The ZTEM Tipper components are calculated with an average distance of 10m at six (6) discrete frequencies —either 25Hz- or 30Hz- series, according to local power line distribution frequency— logarithmically spaced in the 20Hz-1000Hz range (Table 1). In this frequency band, the Earth Magnetic power spectrum is controlled by thunderstorm activity, which is at peak in the mid-to-low latitudes and becomes detectable during summer season in Polar Regions.
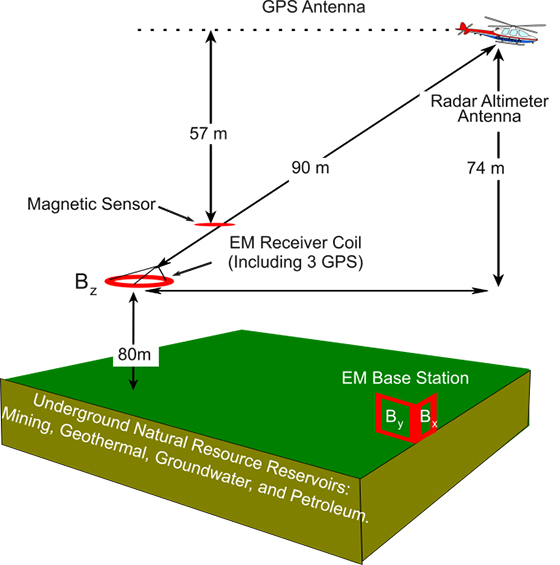
Figure 1: ZTEM main features. State of the art GPS technology and highly sensitive receiver coils are used to compute Magnetic Tipper Tensor.
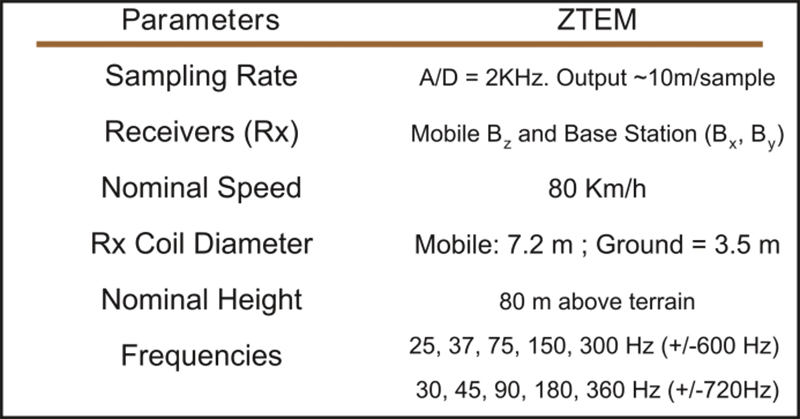
Table 1: Summary of ZTEM Specifications
ZTEM Tipper values are different to zero over areas where there are lateral resistivity changes at probing depths, depicting characteristic cross-over anomalies along flight paths (Fig. 2). Amplitude values for both Tzx and Tzy are represented as In-Phase (IP) and Quadrature (QD) and expressed in percentage (%). In ZTEM convention, IP polarity changes from positive to negative over anomalous conductive zones and the opposite is true over resistive ones. In case of smooth or small lateral resistivity variation the Tipper is expected to be <10%; while in regions of sharp or large resistivity contrasts the Tipper can be >20%. In addition, Tipper amplitudes decrease as target depth increases.
A similar EM-observable is obtained in MT, although with sparsely distributed stations and wider frequency range. According to exploratory frequency range, MT is typically divided in two groups: 10-3 – 10 Hz and 1 – 104 Hz, with this latter commonly referred to as Audio MT (AMT). In addition, EM Impedances are computed in ground MT by including electric field components (Ex,Ey).
Hence, MT and ZTEM are complementary technologies. MT detects deeper with better resolution but limited coverage; whereas ZTEM has an unsurpassed capability to map resistivity contrasts from the air over extended areas at depths not reached before by active source AEM technology. This latter is particularly useful for effectively orienting MT campaigns and to help extrapolate imaging results to regional scale. Integration of ZTEM and MT has therefore become possible and valuable.
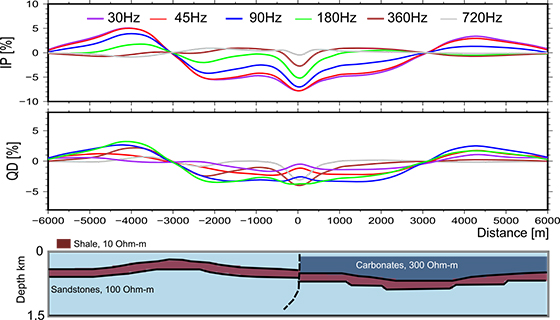
Figure 2: Characteristic ZTEM crossovers over a sedimentary environment with subtle resistivity changes. Top panel displays Real (Tzx) and Imag (Tzx), i.e. In-Phase (IP) and Quadrature (QD) of Tzx. Tipper anomalies are different to zero where there is lateral resistivity contrast. Cross-over point is located above the anomalous resistivity change. A decrease in resistivity causes polarity change from positive to negative and vice versa otherwise. Though geological contacts or faults are observed as peaks or valleys according to whether resistivity decreases or increases, respectively.
ZTEM in Sub-Basalt Basins
Continental Sub-Basalt Basins are large sedimentary sequences underlying tens to hundreds of meter thick, igneous provinces, e.g. Paleozoic Paraná Basin in Brazil, the Columbia River Basalt Group (CRBG) in USA, and Deccan Traps in India. Different petroleum systems are held within these basins or trapped inside the volcanic rocks. A great percentage of them are estimated economic and mainly Gas-associated due to high thermal input from igneous activity. Traditional geophysical exploration is challenging in these areas since seismic methods encounter severe imaging problems due to energy dispersion inside the volcanic units. On the other hand, MT surveys are useful in mapping these volcanic rocks since they are at least one order of magnitude more resistive than underlying sedimentary units. MT is also favored by substantial variation in thickness exhibited across these provinces due to episodic volcanic activity. Fig. 3 summarizes main MT observations of Sub-Basalt Basins with an example from Paraná Basin in Brazil, the display of 1 D-MT inversion results highlights the vertical resistivity layering as much as the wide range of basalt thickness expected in these basins. Resistivity is fairly homogeneous in the volcanic cover with values well above 1 00 Ohm-m; whereas its thickness varies from few hundred meters to about 1 Km.
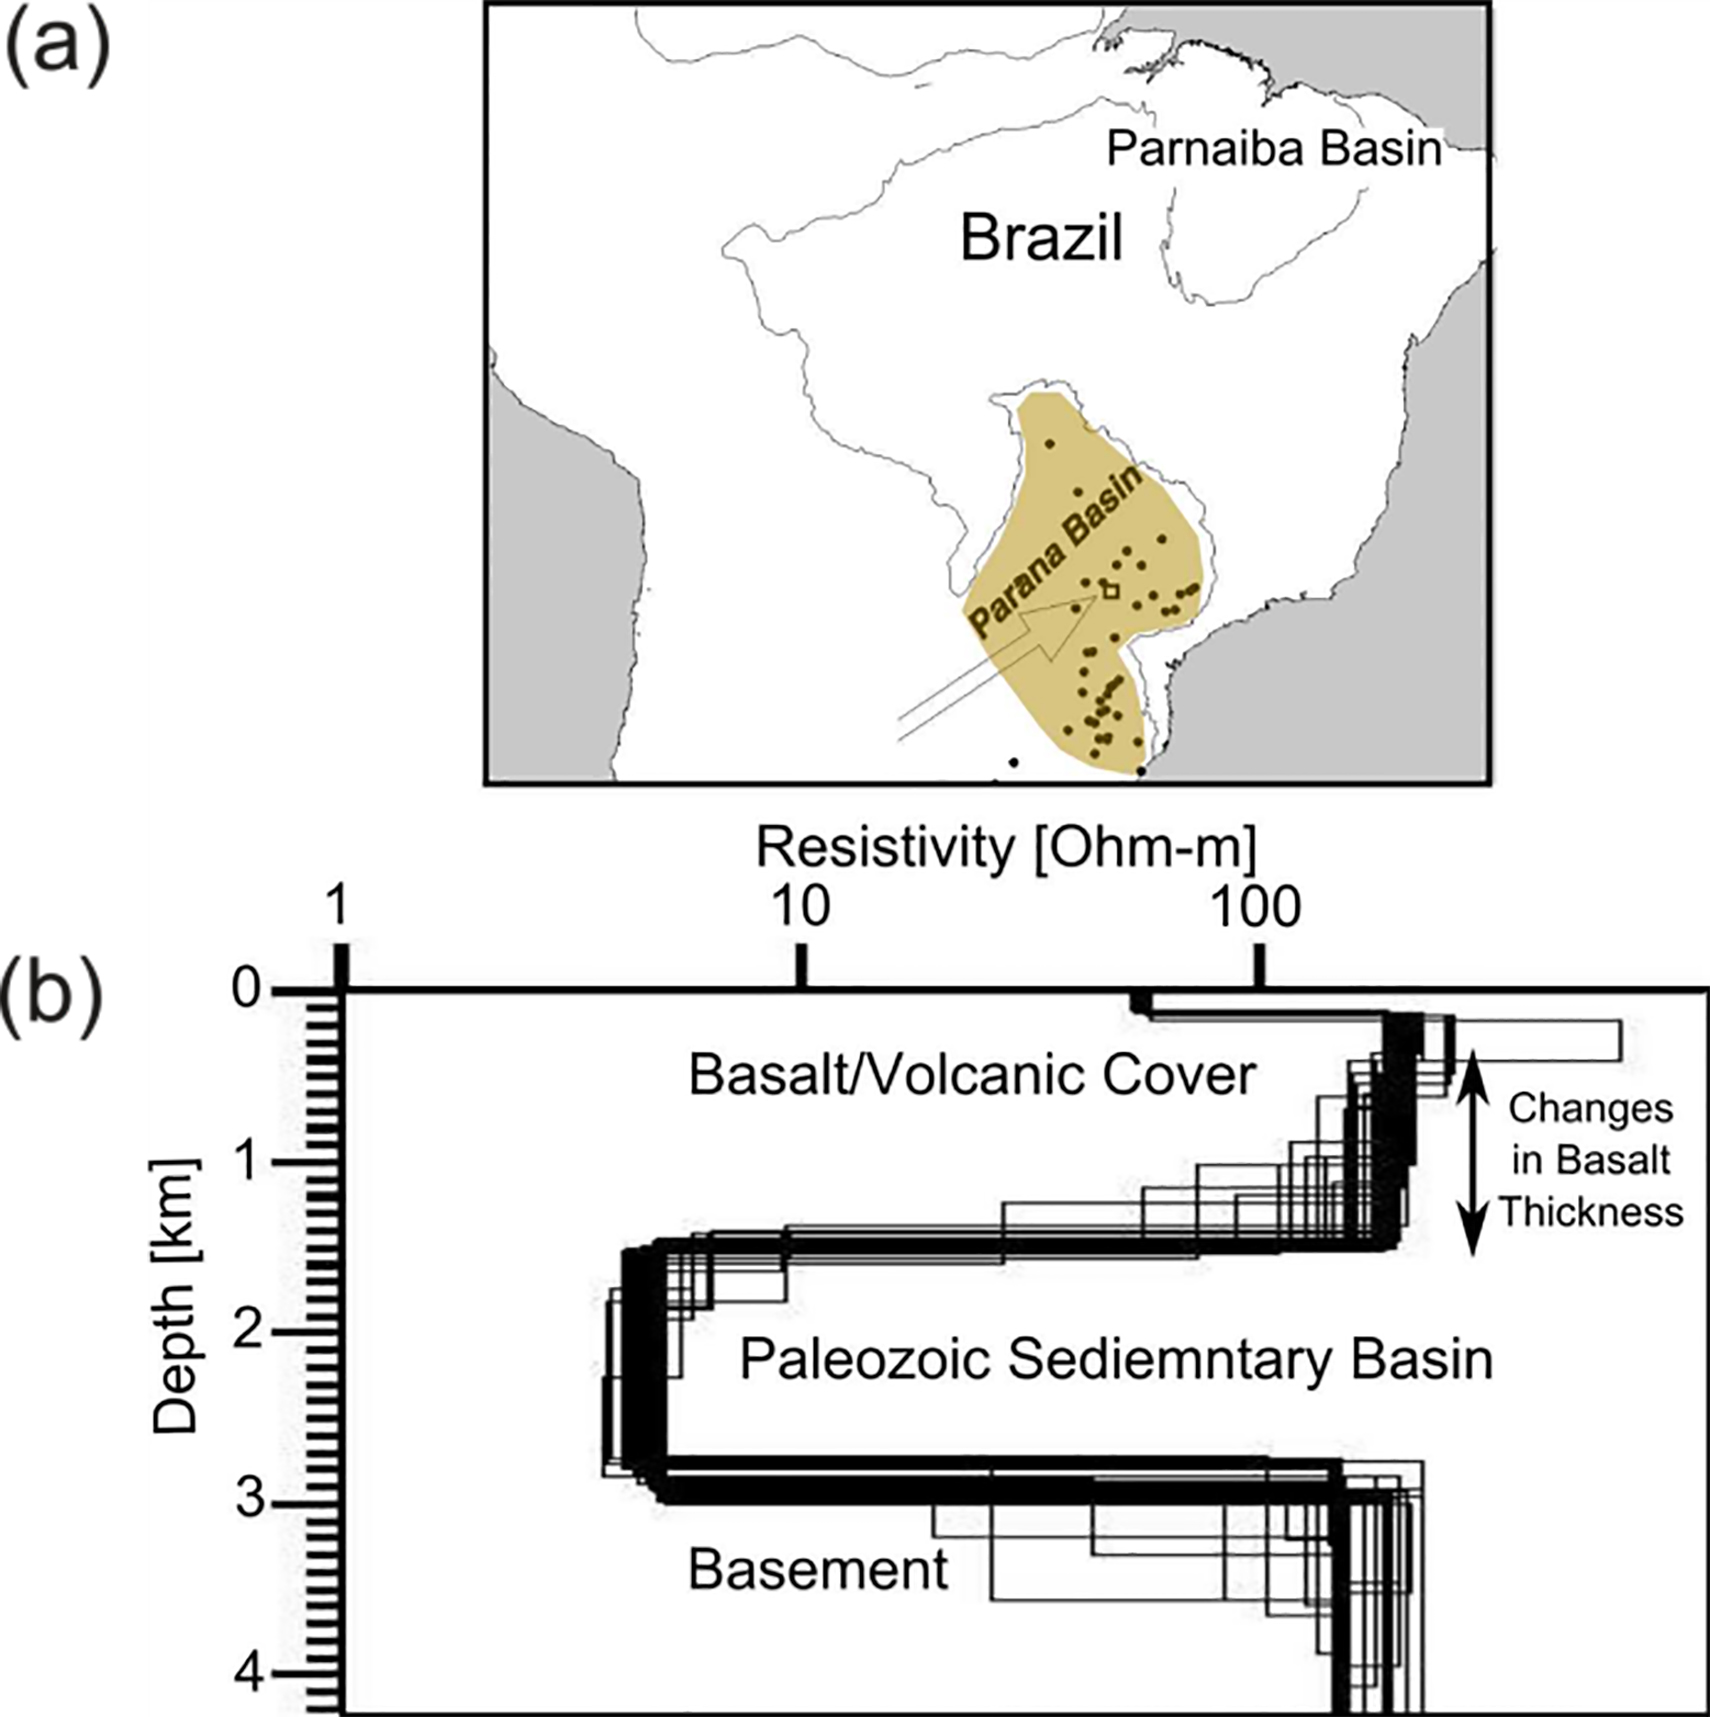
Figure 3: a) Map showing the location of MT stations (shown in dots) spread out over the Paraná Basin, Brazil, (b) 1D inverted resistivity models from MT observations. These models clearly depict both the basic vertical structure of Sub-Basalt Basins and the wide range of volcanic thickness atop the sedimentary sequence (modified after Zevallos et al., 2004).
Fig. 4 shows that ZTEM anomalies respond well to changes in the basalt thickness. ZTEM’s lower frequencies, namely 30Hz to 90 Hz, map both anomalous thickening and thinning of basaltic cover with distinct cross-overs. This in turn can prove useful for effective planning of MT locations and thus reducing exploration costs and risks.
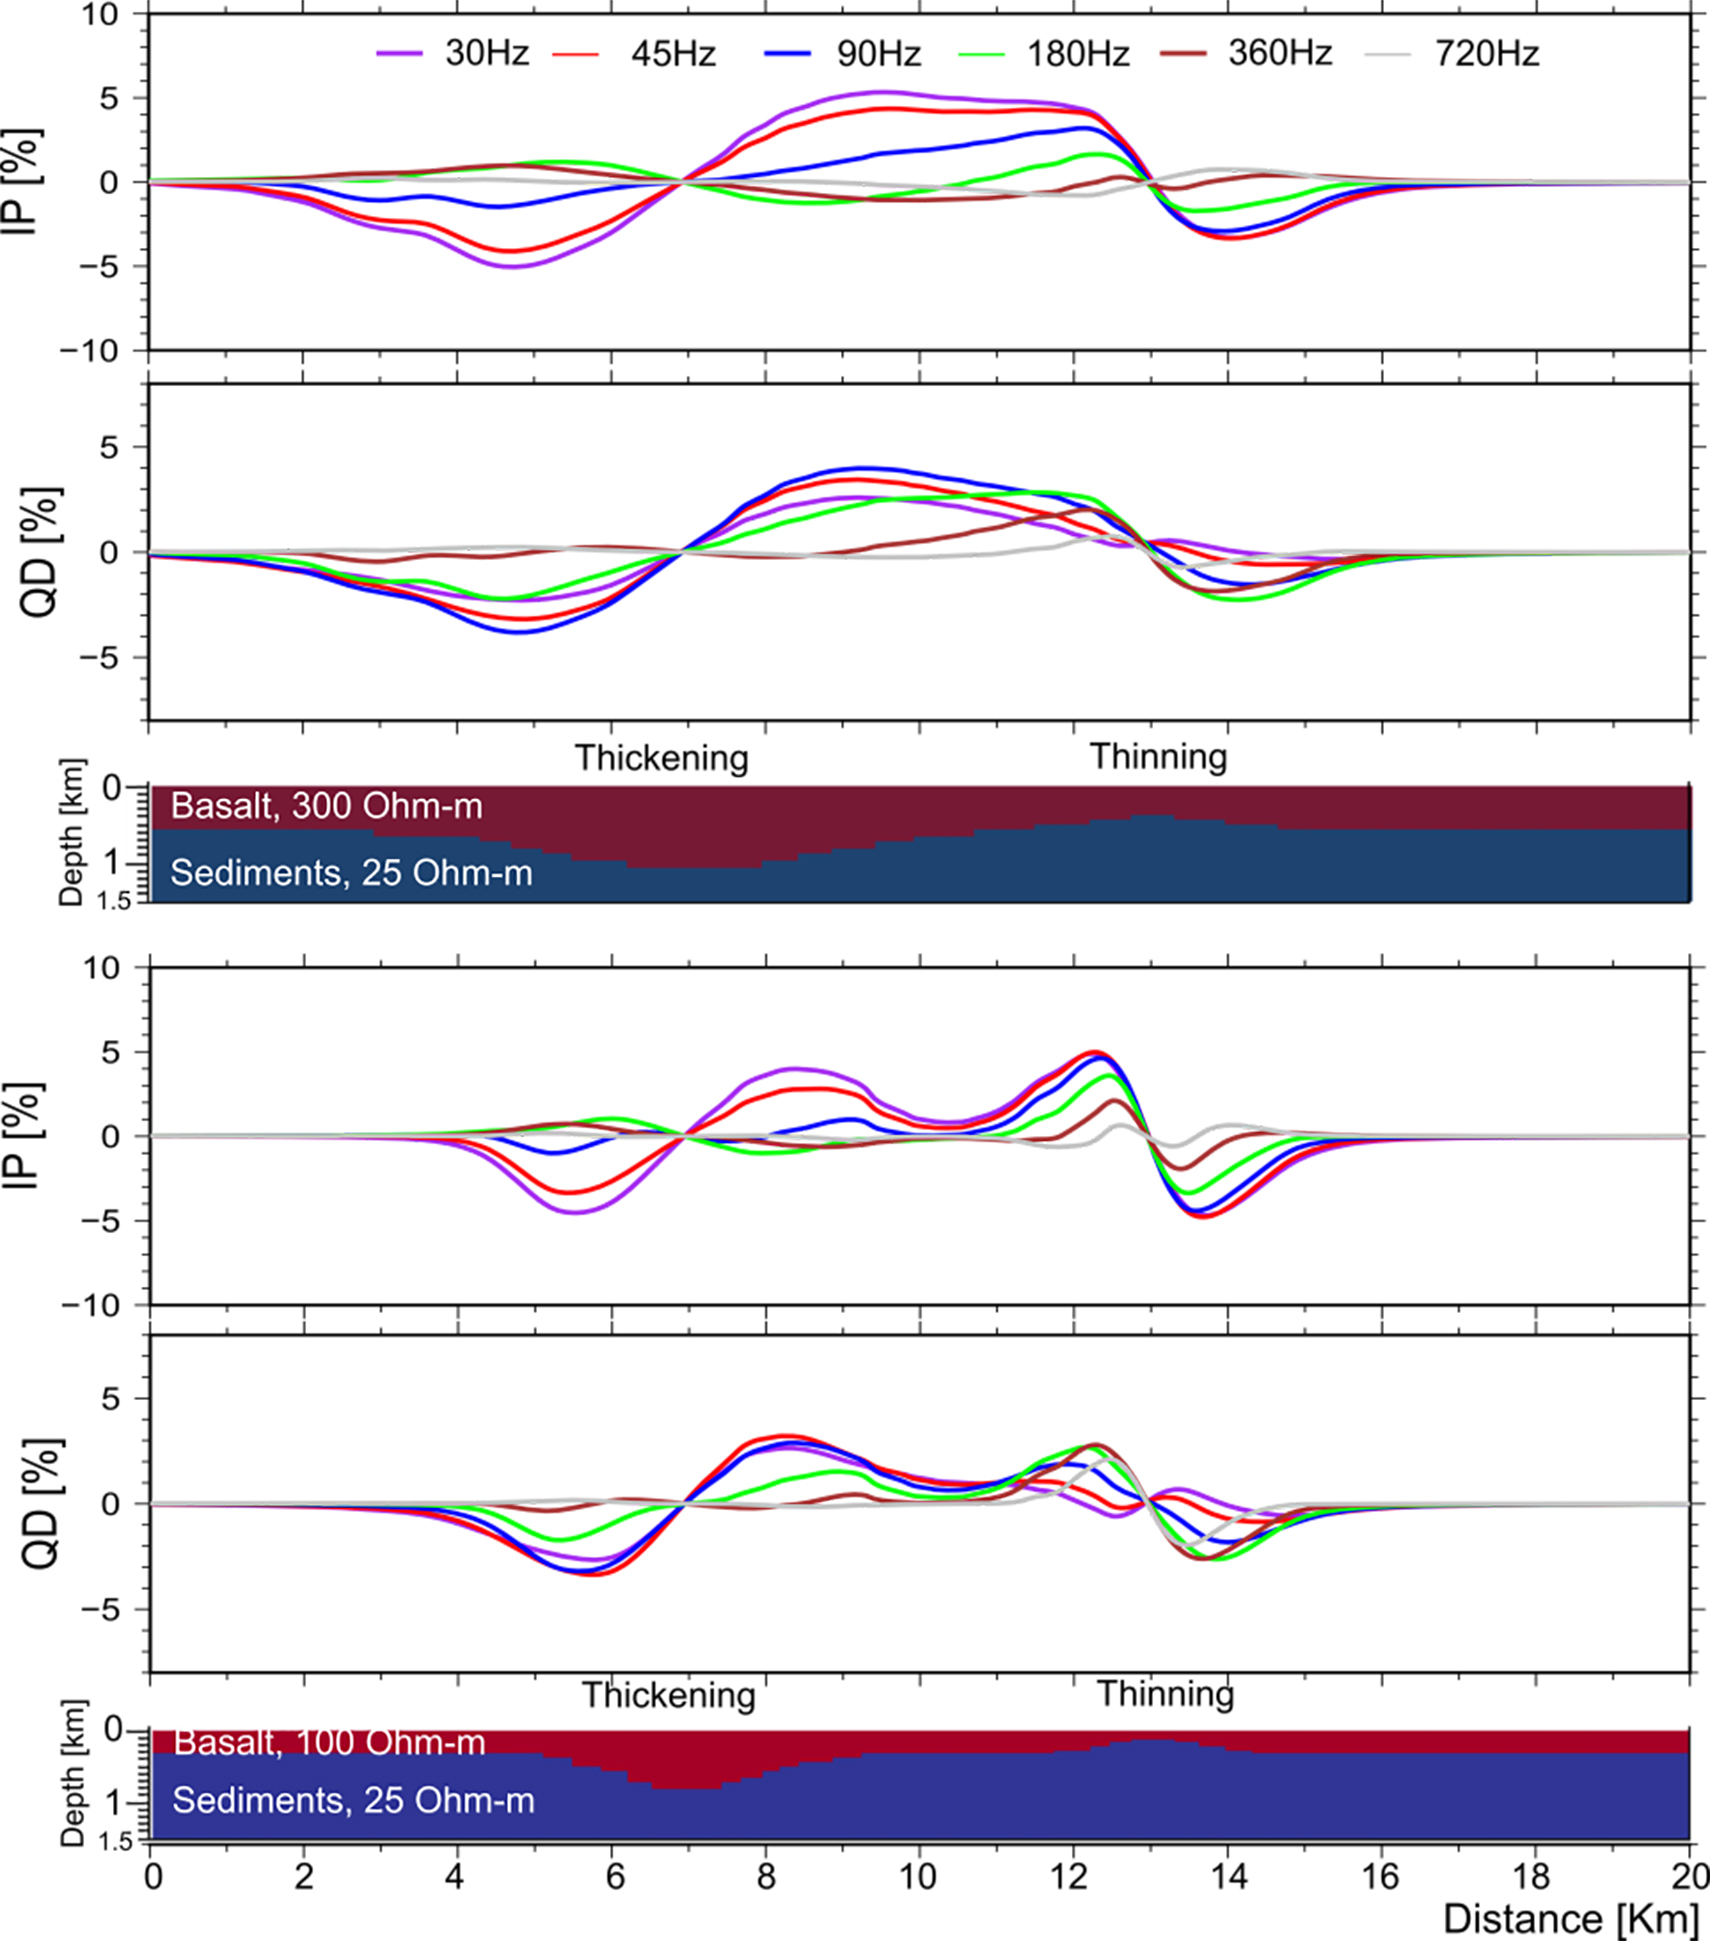
Figure 4: ZTEM Numerical modelling over Sub-Basalt Basin. (Top Panel) A model of thick volcanic cover and smooth lateral changes. (Bottom Panel) A model of thin volcanic cover and sharper lateral changes. Both results show detectable cross-overs anomalies above the anomalous thicknesses.
ZTEM in Foothill Basins
Foothill Basins are distributed worldwide in front of large continental mountain ranges like The Andes in South America and Rocky Mountains in Canada. They are prolific in deep Gas and Oil reservoirs and difficult targets for conventional seismic exploration due to seismic scattering from highly steep geological structures resulting in poor imaging. Once again, MT has proven valuable since sub-vertical faults and uptight folds create well defined lateral contrast in resistivity, which are traditionally surveyed in Mining and Geothermal exploration programs using EM. Fig. 5 shows resistivity sections from 3D (top panel) and 2D (bottom panel) MT inversions obtained from a pilot 3D MT campaign in an Andean Foothill Basin located in Bolivia. The ultimate objective is to map a deep-seated sandstone reservoir underneath a highly deformed thick sequence of shale and sandstones. Only 3D inversion results validated observations from oil wells and geology models.
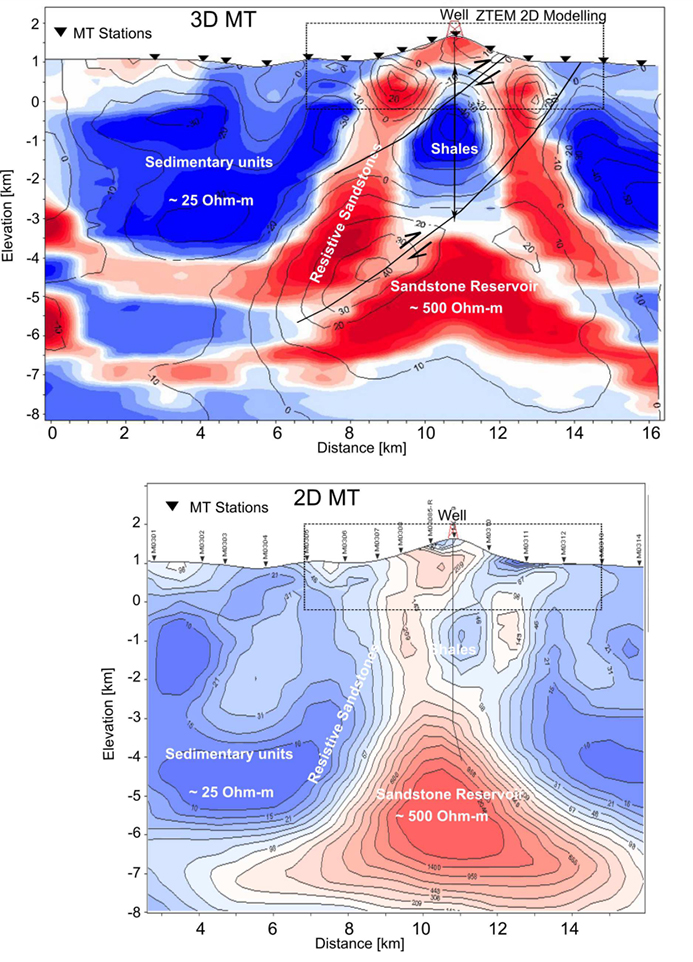
Figure 5: Resistivity images of a Foot Hill basin across the foreland deformation front of the Bolivian Andes. (Top panel) A resistivity section from 3D MT inversion of a 3D MT campaign in Bolivian Foot Hill Basin. (Bottom panel) Same profile but with resistivity distribution obtained from 2D MT inversions. Note that 3D results resolve better main elements associated with well-tested deep sandstone reservoir (modified after Ravaut et al. 2012). Faults are phony and displayed only to emphasize the highly sub-vertical structures encountered in these geological settings.
In order to evaluate the feasibility of using ZTEM to help map top units in the deformation front and minimize the use of MT stations, a numerical forward modelling was carried out. Resistivity model is taken from 3D MT results. Fig. 6 (top panel) shows a ZTEM profile with anomalies well above 1 0% and cross-overs clearly responding to intercalation of sandstone and shale from the flank to the center of the hill. Furthermore, 2D-ZTEM inversion recovers main features within acceptable resolution in the first 1 km of depth (see Fig. 6, bottom panel). There are, therefore, sound reasons to pursue joint ZTEM-MT campaigns in suitable areas like this where costs and time are crucial.
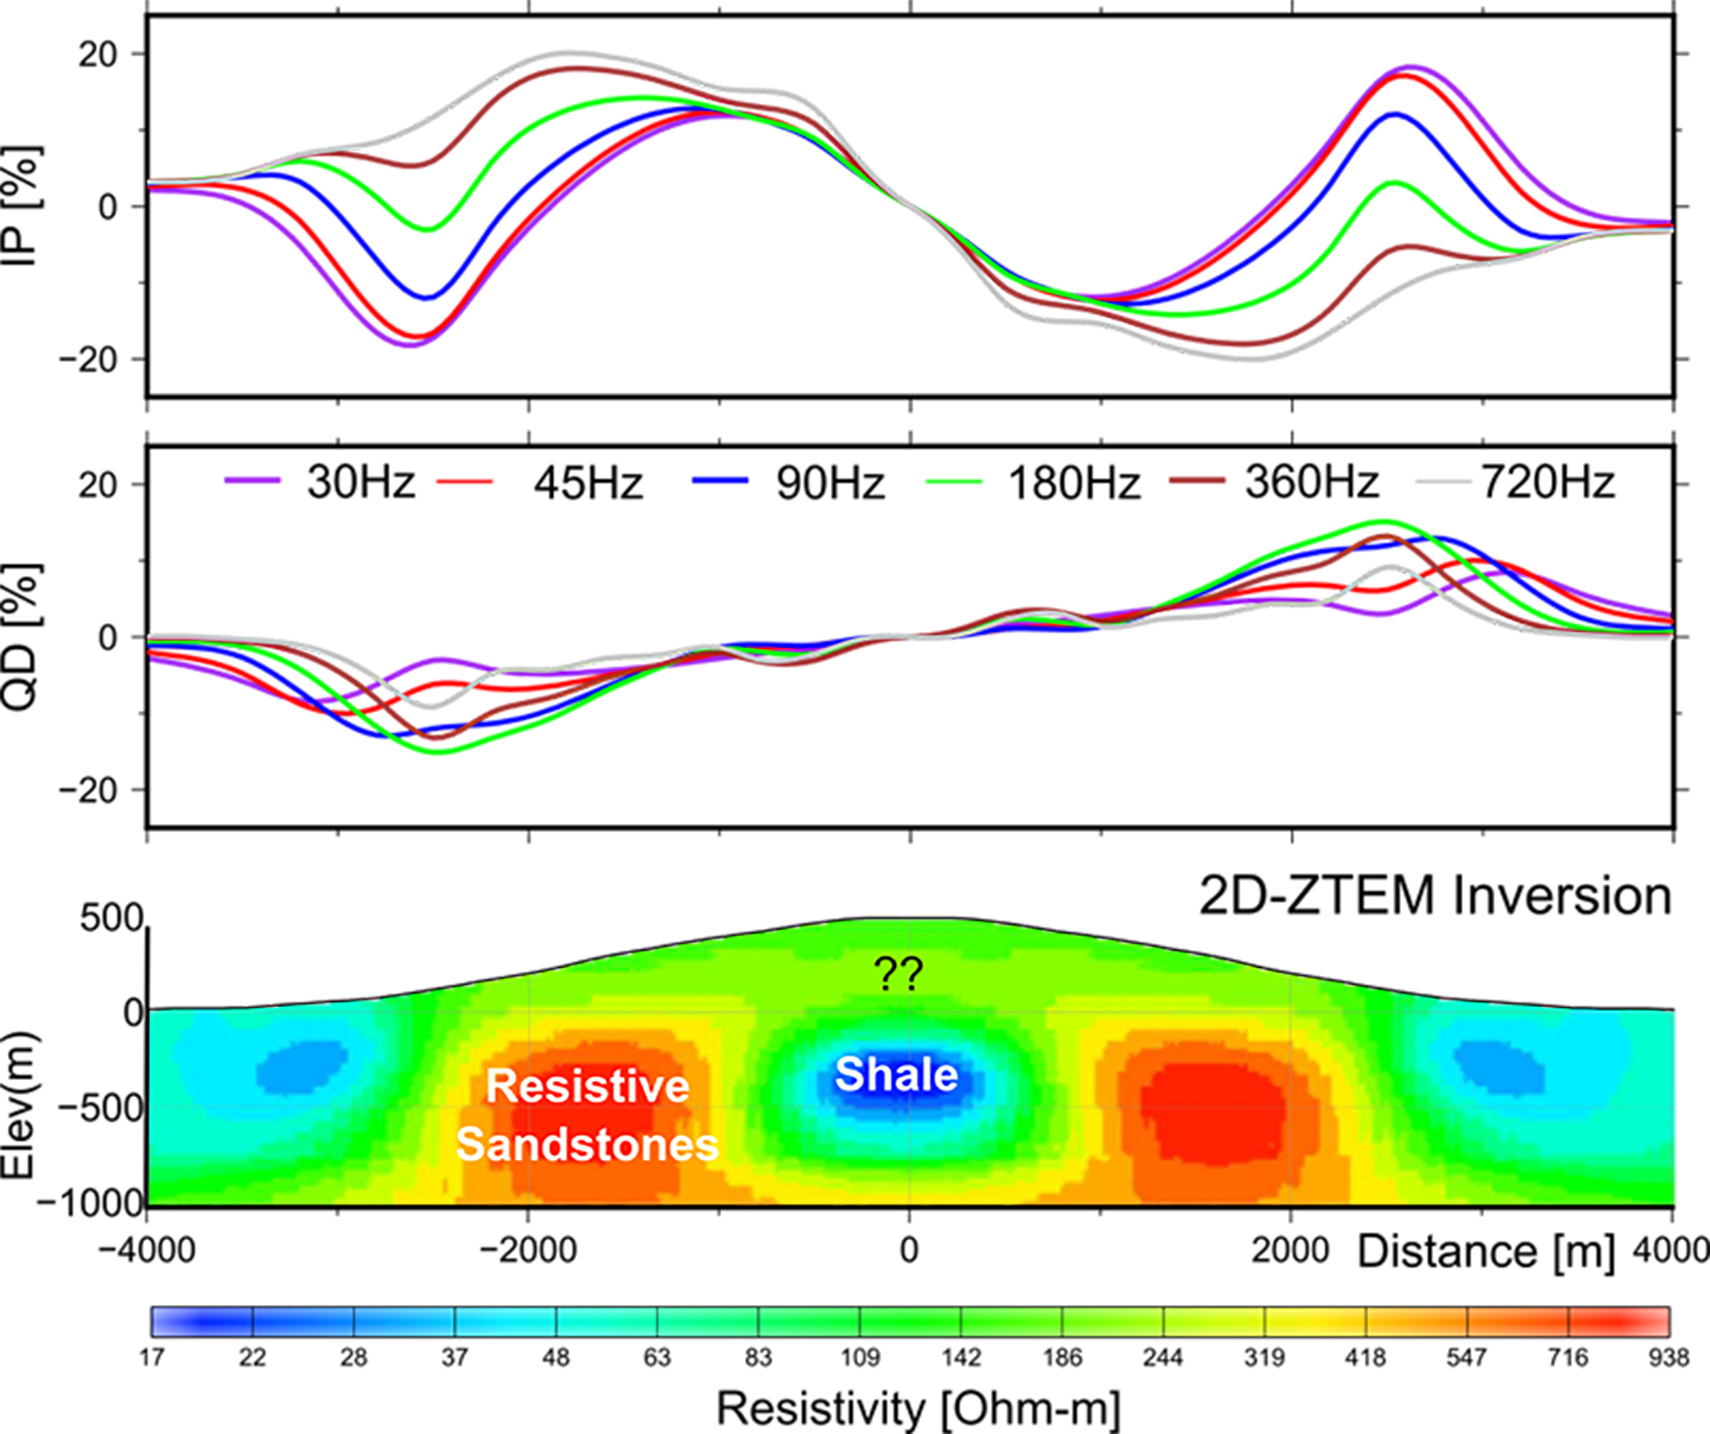
Figure 6: ZTEM numerical modelling and 2D inversion result over Foot Hill Basin in the Andes.