Presented at 12th SAGA Biennial Technical Meeting and Exhibition.
For a PDF of this paper click here
Abstract
Heliborne VTEM™ and ZTEM™ surveys were flown over East Bull Lake Intrusive Complex near Massey ON. The VTEM™ results show good correlation with known occurrences and identify new areas for follow-up. The ZTEM™ survey results correlate well with known geology and provide indications of deep structure that agree with previous scalar and tensor AMT survey results. Comparisons between these data sets and the East Bull Lake geol-ogy and structure are showcased using 1D-2D-3D inversion modeling.
Key words: ZTEM™, VTEM™, AFMAG, electromagnetic, airborne, PGM, anorthosite
Introduction
In September 2010, Mustang Minerals Corp. (Toronto, ON) contracted Geotech to fly heliborne ZTEM™ sur-vey over East Bull Lake property (Figure 1). The sur-vey followed a previously successful VTEM survey in May-June, 2007. The East Bull Lake Intrusion (EBLI) is a 20km long gabbro-anorthosite intrusive complex located 80km west of Sudbury, Ontario. It consists of two separate zoned intrusions joined by a 5km long feeder dyke (Figure 2). The EBLI is also crosscut by two major structures: the Folson Lake (FLFZ) and Pa-risien Lake (PLFZ) fault zones; Figure 2). The property is considered to have excellent potential to host a sig-nificant nickel-copper, PGM (platinum group metal) deposit but is, as yet, not developed for mining.
Property History
The East Bull Lake area had seen limited mineral ex-ploration activity take place between 1950 and 1962 involving a number of mining and exploration compa-nies that were exploring a portion of the property for gold, copper and nickel deposits. The potential for PGM deposits on the property was not considered until the late 1980’s (Brisbin et al., 2001).
In the early 1980’s, EBLI was also one of a small number of Precambrian crystalline intrusions selected by Atomic Energy of Canada Ltd. to test the capability of geotechnical methods for defining fault structures within bedrock and also for the purpose of evaluation for long-term storage of nuclear waste. At that time, in addition to ground VLF EM, magnetic, gravity surveys, both scalar and tensor audio magnetotelluric (AMT-MT) survey measurements were obtained on the site by the GSC (Kurtz et al., 1986; Figure. 3).
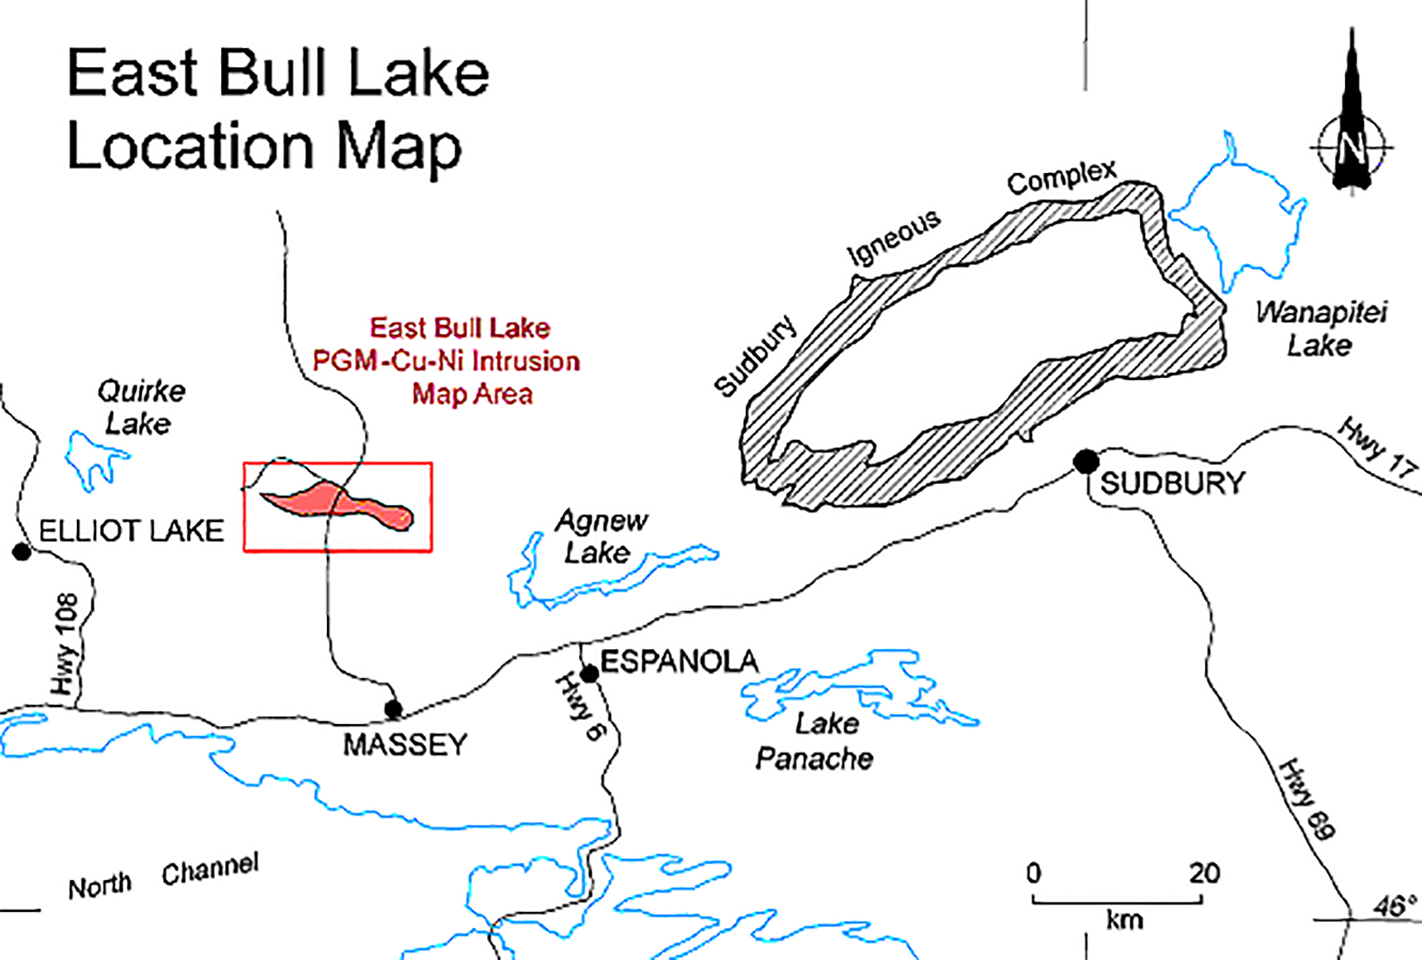
Figure 1: East Bull Lake property location (courtesy Mustang Minerals corp).
In addition to identifying the ESE-WNW trending Fol-son Lake fault zone (FLFZ) as a major regional con-ductive structure (Figure 2-3a), on the basis of the AMT-MT results, a well resolved conductor was found at a depth below 800m (Figure 3b) and was later drill-tested by AECL to reveal a faulted, troctolitic later marking the base of the East Bull Lake intrusive, which was also PGM-mineralized (R. Dunbar, Mustang Min-erals, pers. comm.., Sept-2010).
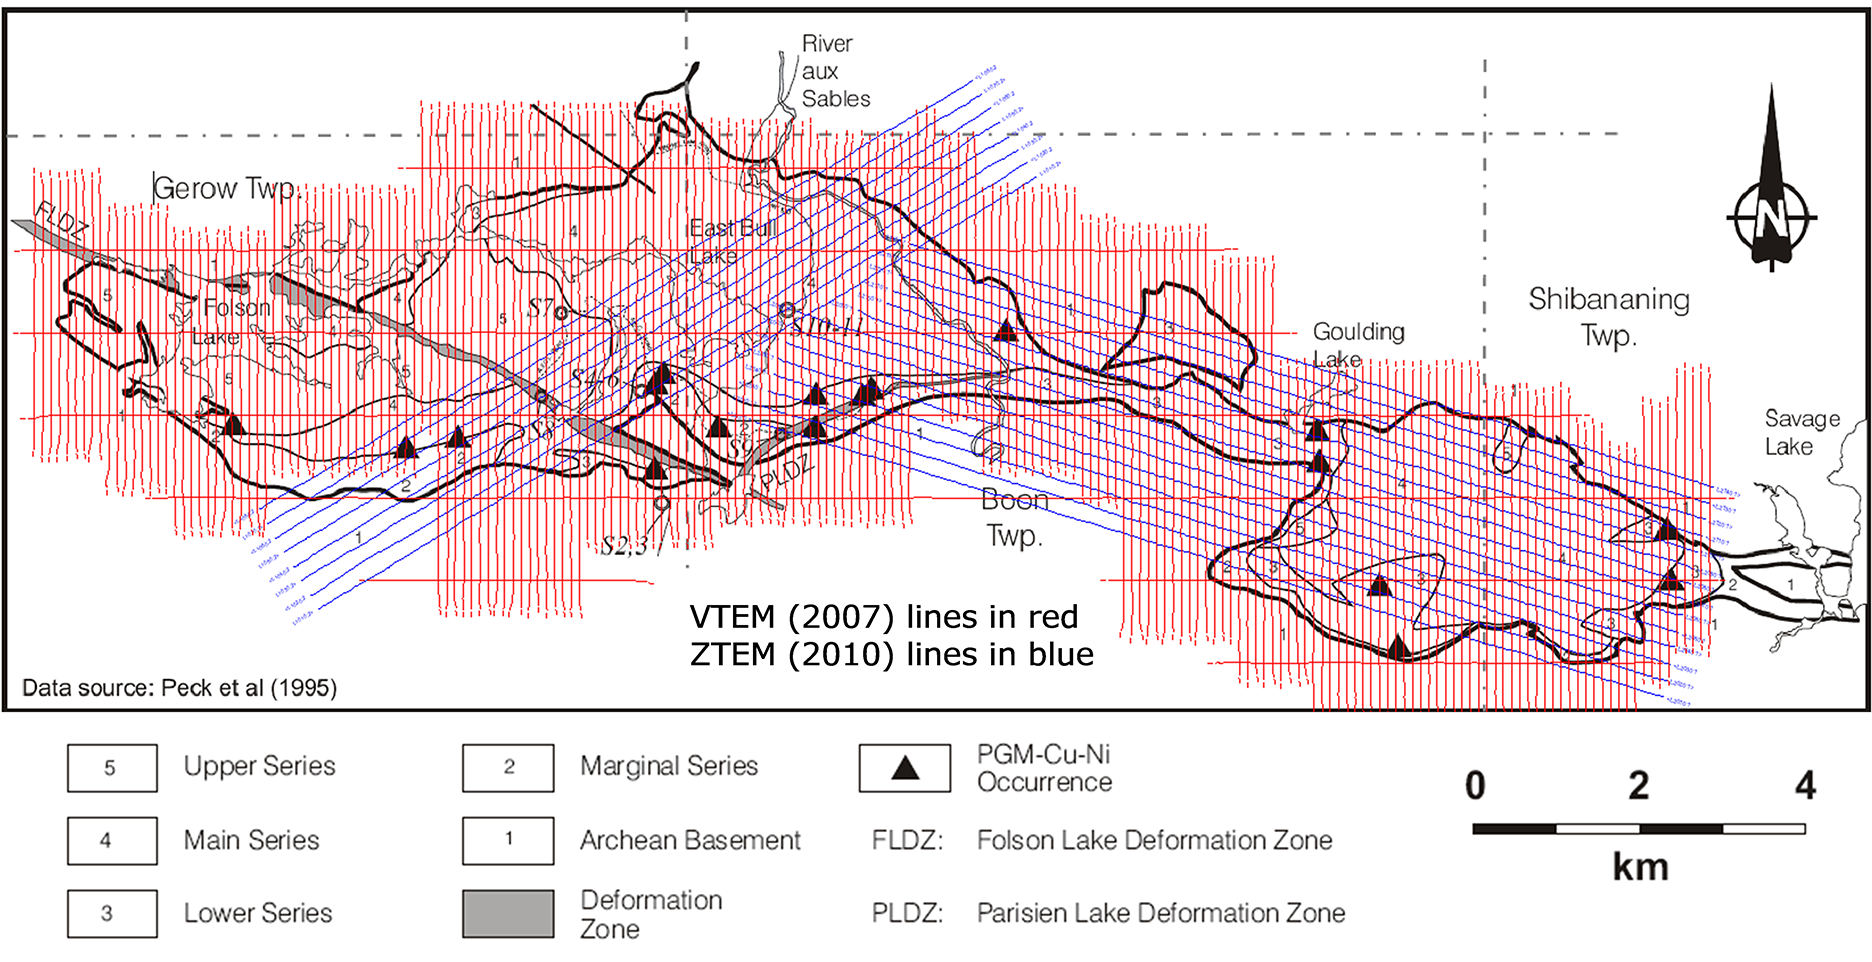
Figure 2: East Bull Lake Intrusion geology, PGM occurences and VTEM™-ZTEM™ survey lines (modified after Brisbin et al., 2001).
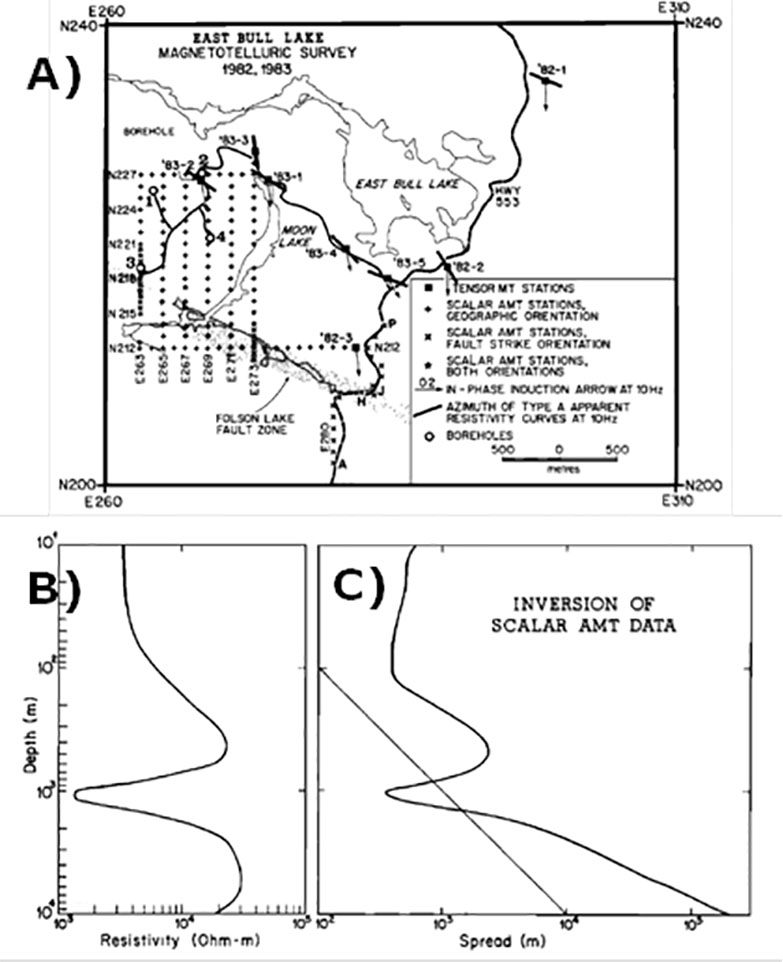
Figure 3: a) Location of scalar AMT and tensor MT sites obtained at East Bull Lake in 1982 and 1983; b-c) 1D inversion of scalar AMT data over EBLI, showing well resolved conductor at depth below 800m (after Kurtz et al., 1986).
In 1990, the Ontario Ministry of Northern Develop-ment, Laurentian University and Ontario Geological Survey completed an extensive study of EBLI that concluded that the “potential exists for extremely large tonnages of sulphide mineralization, perhaps even massive sulphides (along the floor of the intrusion), which have platinum-group element-enrichment levels equating to reef environments” (www.mustangminerals.com). Geologic mapping has determined that the lower and marginal series phases of EBLI (Figure 2) host all known PGE-rich mineraliza-tion, found mainly in disseminated sulphides (<1%) but also as high as 10% massive to semi-massive chal-copyritic and pyrrhotitic sulphides (Brisbin et al., 2001).
Following the 2007 VTEM™ survey over East Bull Lake, prospective EM anomalies were identified in areas where mineralization was previously unknown and which were later proven to be associated with highly anomalous nickel-copper-PGM values in surface samples and drilling.
In early 2008 initial drilling of a VTEM™ target at Parisien Lake yielded intersections that included 1.1m of 9.3% copper and 12/5 g/t PGM from 89m down hole depth and 10m of 0.4% nickel at shallow depth. Historical drilling at East Bull Lake prior to Mustang’s involvement intersected 0.5m of 3.9 % nickel in the central part of the intrusion (www.mustangminerals.com). The ZTEM™ survey objectives were to define potential deep extensions or structures potentially associated with the VTEM™ mineralized conductive features.
VTEM™ Survey Results
The 2007 VTEM™ (versatile time-domain electro-magnetic) system (Witherly et al., 2004, Witherly and Irvine, 2006, Prikhodko et al., 2010) survey (Orta and Bagrianski, 2007) consisted of 867 line-km flown along 100m spaced NS lines and 1km spaced EW tie-lines, with EM and magnetic sensors at 40m and 65m avg. elevations, respectively. The VTEM™ and mag-netic results at EBLI are presented in Figures 4-5. The late-channel (off-time) EM Time Constant (Tau) image in Figure 4a was obtained from the Z-coil, dB/dt response.
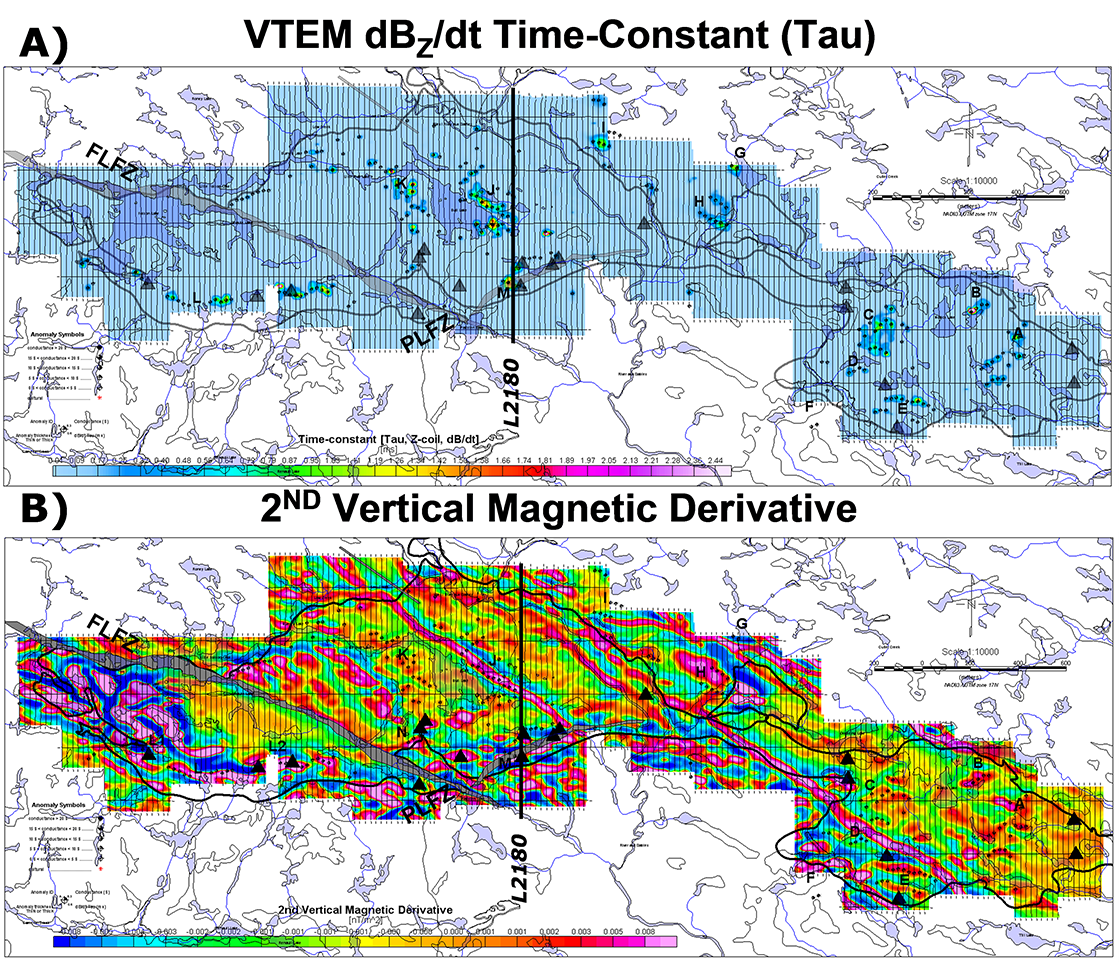
Figure 4: East Bull Lake VTEM™ survey results: a) dBZ/dt timeconstant (Tau) and b) 2ND vertical magnetic derivative of TMI, with EM anomaly picks, anomalous zones (A-N), known mineral occurrences (triangles) and EBLI outline.
For potential conductive mineralized targets, the eddy current decays more slowly with of time, giving larger values of Tau, relative to poor conductors. Medium-to-large values of Tau, with responses extending into late times, are an indication of potential mineralization for base-metal and PGM exploration. VTEM™ anomalies are generally not expected over disseminated sul-phides, unless secondary enrichment is present.
At EBLI, small-to-medium values of Tau in the range of 0.21 to 3.3 milliseconds were measured in the dBZ/dt data (Figure 4a and Figure 5b); with a similar range obtained from the BZ-field response. Anomalies (A-N – Figure 4) occur as either small isolated groups or as short lineaments.
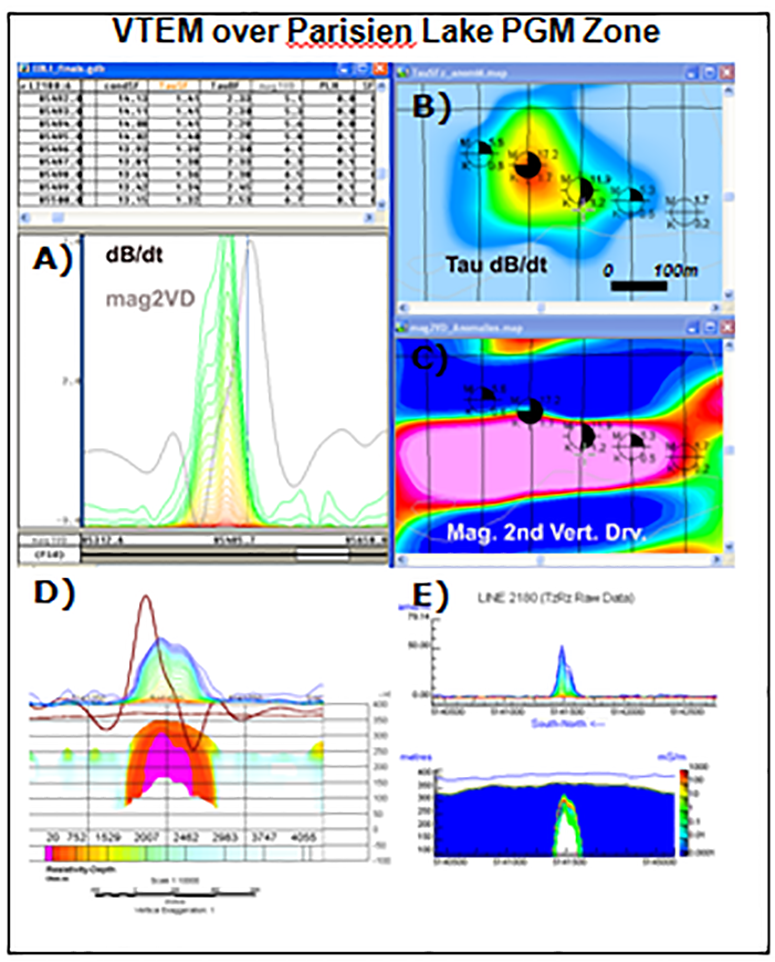
Figure 5: a) VTEM™ survey results over Parisien Lake PGMsulphide occurrence (Anomaly M): a) dBZ/dt late-channel decay and magnetic 2VD profiles. b-c) plan views dBz/dt Tau and magnetic 2VD of TMI with picked EM anomalies; d) RDI effective resistivity and e) EMflow CDI cross-sections.
In order to discriminate between near surface and deepest sources, the second vertical magnetic derivative was calculated (Figure 4b). Magnetic lineaments related to late dikes and secondary faults are observed with north-west to south-east trends. Stronger magnetic signatures along the southern margin of EBLI, where the mineral occurrences are concentrated, relate to the lower and marginal series phases that feature higher magnetite and are also PGM sulphide enriched (Brisbin et al., 2001). Most VTEM™ anomalies have a strong magnetic correlation, while others (C, K, I) are only weakly magnetic.
VTEM™ anomaly (M) located in the lower margin suite of rocks of the EBLI was the target that was drill-tested at Parisien Lake and that intersected two miner-alized zones in 2008. Figure 5c presents the RDI resis-tivity-depth image (Meju, 1998) over L2180 from Pa-risien Lake (Figure 4) that shows the strongest conduc-tive anomaly at 93 metres of depth (just 4 metres below actual); but with an exaggerated depth extent of 90 metres. The EmflowTM conductivity-depth image (CDI; Figure 5d) misplaces the top of the target at a shallower depth of 69-72 metres (20 metres above); but is more realistic in terms of its depth extent of just a few metres. From both these results, we conclude that the VTEM™ response is accurately mapping the massive Cu-PGM sulphide occurrence intersected at 89m down hole. MaxwellTM 3D EM plate models corroborate these results.
ZTEM™ Survey Results
ZTEM™ (z-axis tipper electromagnetic) is an airborne variant of the AFMAG natural field EM technique (Ward, 1959; Labson et al., 1985) where a single verti-cal-dipole air-core receiver coil is flown over the survey area in a grid pattern, similar to regional airborne EM surveys. Two orthogonal, air-core horizontal axis coils are placed close to the survey site to measure the horizontal EM reference fields. Data from the three coils are used to obtain the Tzx and Tzy Tipper (Vozoff, 1972) components at five to six frequencies in the 30 to 720 Hz band.
The 2010 ZTEM™ system (Lo and Zang, 2008; Lo et al., 2009ab; Legault et al., 2009ab; Pare and Legault, 2010; Sattel et al., 2010ab) survey consisted of 228 line-km flown along 200m spaced lines over two sur-vey blocks, East and West, that centred on each EBLI lobe (Venter et al., 2010). East block was flown in a SE-NW (N-107O) direction and West block with NE-SW (N-059O) lines. The EM and magnetic sensors were at 85m and 100m avg. elevations, respectively. The ZTEM™ survey results at EBLI West Block are pre-sented in Figures 6-8.
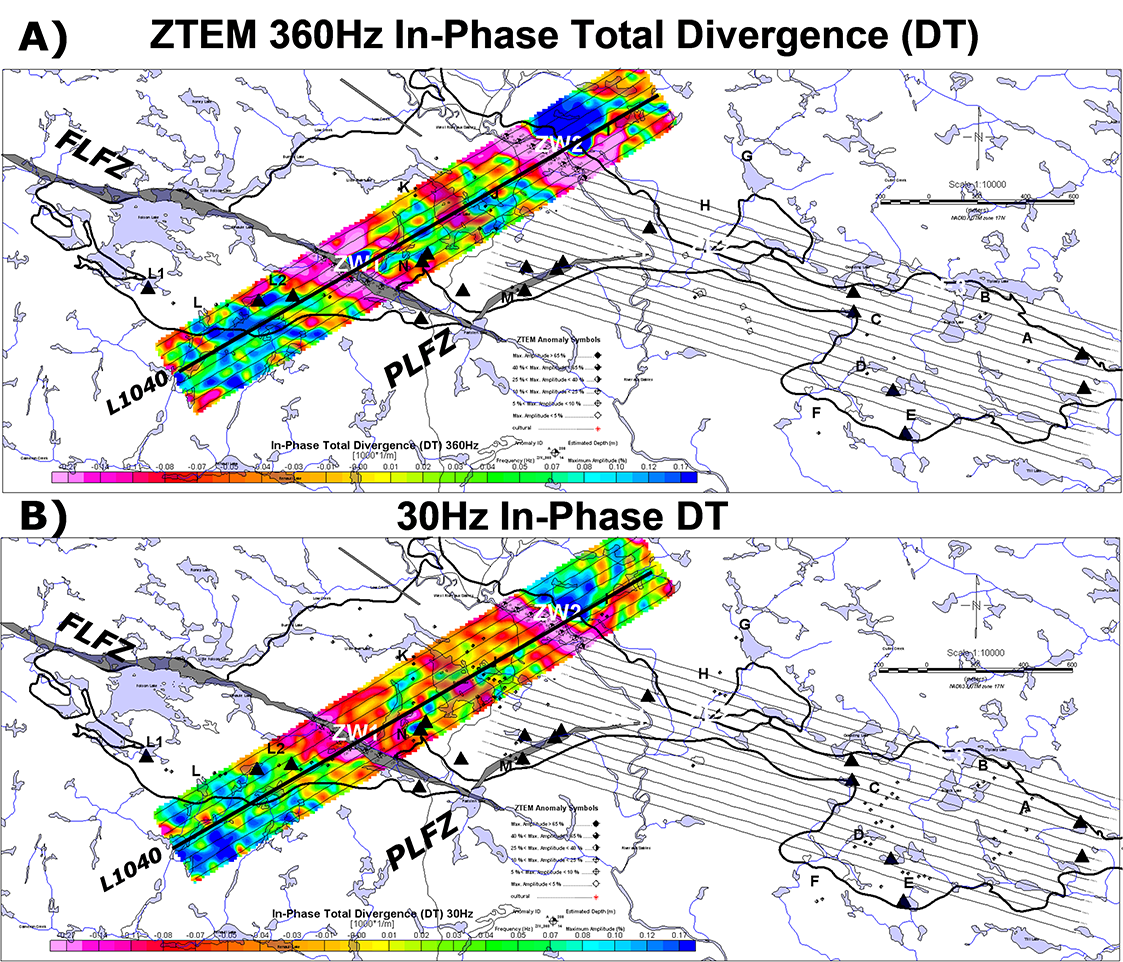
Figure 6: ZTEM™ Total Divergence (DT) of In-Phase Tipper at: a) 360Hz and b) 30Hz, with EM anomaly picks, anomalous zones (ZW1-ZE3), known mineral occurrences (triangles) and EBLI outline. ZTEM™ results from East Block are masked by request.
Figure 6 presents the ZTEM™ tipper results in plan shown as Total Divergence (DT) images (Lo et al., 2009) that are analogous to the VLF Peaker parameter of Pedersen (1998). DT’s convert the tipper cross-overs into peaks for easier interpretation/visualization in plan view. Shown are the high (360Hz) and low (30Hz) frequency DT’s of the In-Phase component, for depth-comparison purposes, with the EBLI outline overlain. Several prominent linear conductive trends are identi-fied (ZW1-ZE2), including the Folson Lake FLFZ and the northern contact of EBLI. The similarity of 360Hz high and 30Hz low frequency results suggests that these major structures subcrop and also have consider-able vertical extent in this skin depth range. However, there seems to be little correlation with ZTEM™ and the VTEM™ anomalies or the known PGM occurrenc-es – this may relate to their limited size and depth ex-tent. It seems that ZTEM™ is defining regional geo-logic structures.
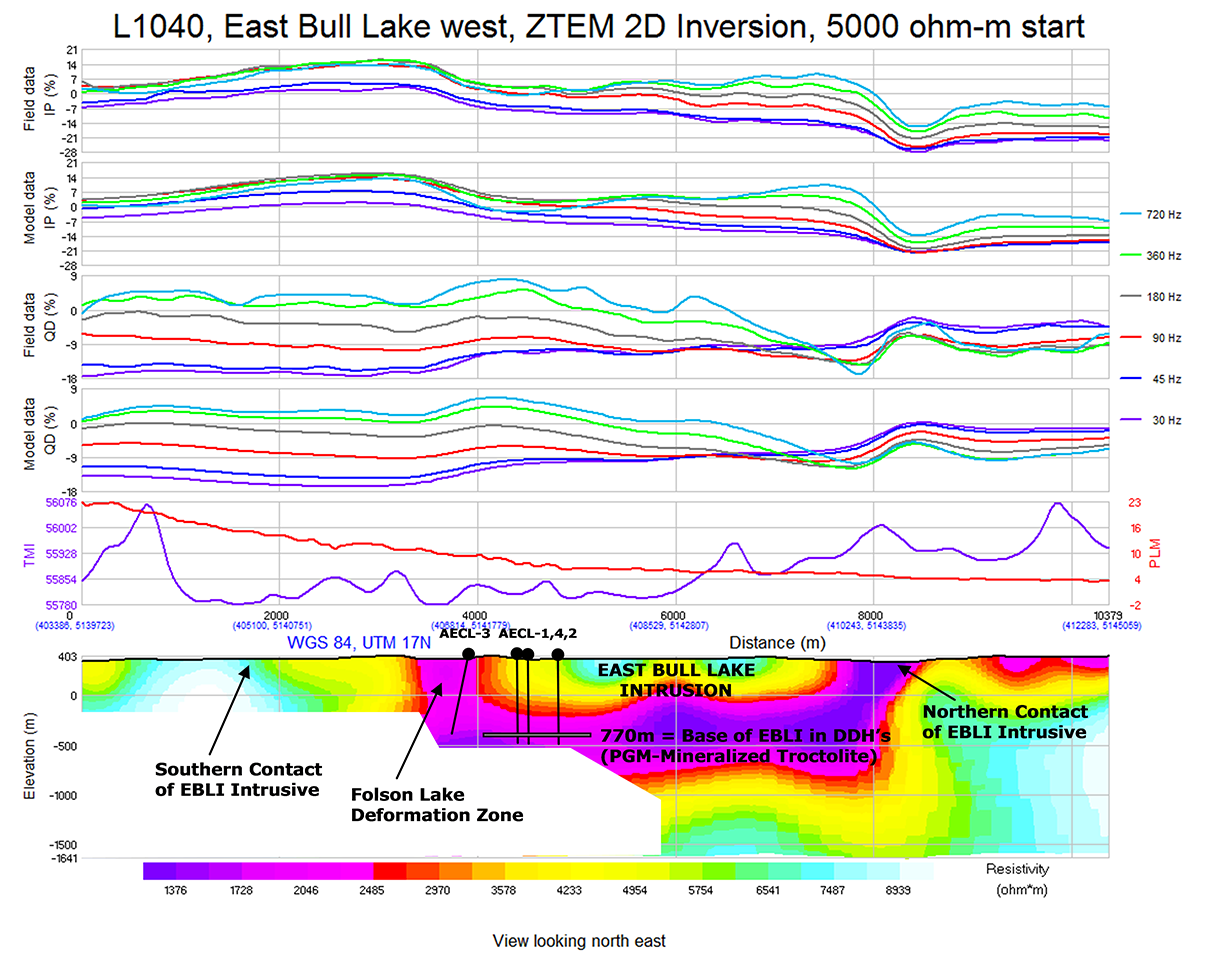
Figure 7: ZTEM™ 2D inversion and for-ward/observed Tzx (In-line) tipper profiles for sur-vey line over EBLI West, with AECL projected drillholes (Fig. 3a), showing excellent correlation with major geologic features, as well as location of 770m depth-to-basement conductive layer predicted by the AMT-MT survey results (Fig. 3b). Results in lower lh corner are masked by request.
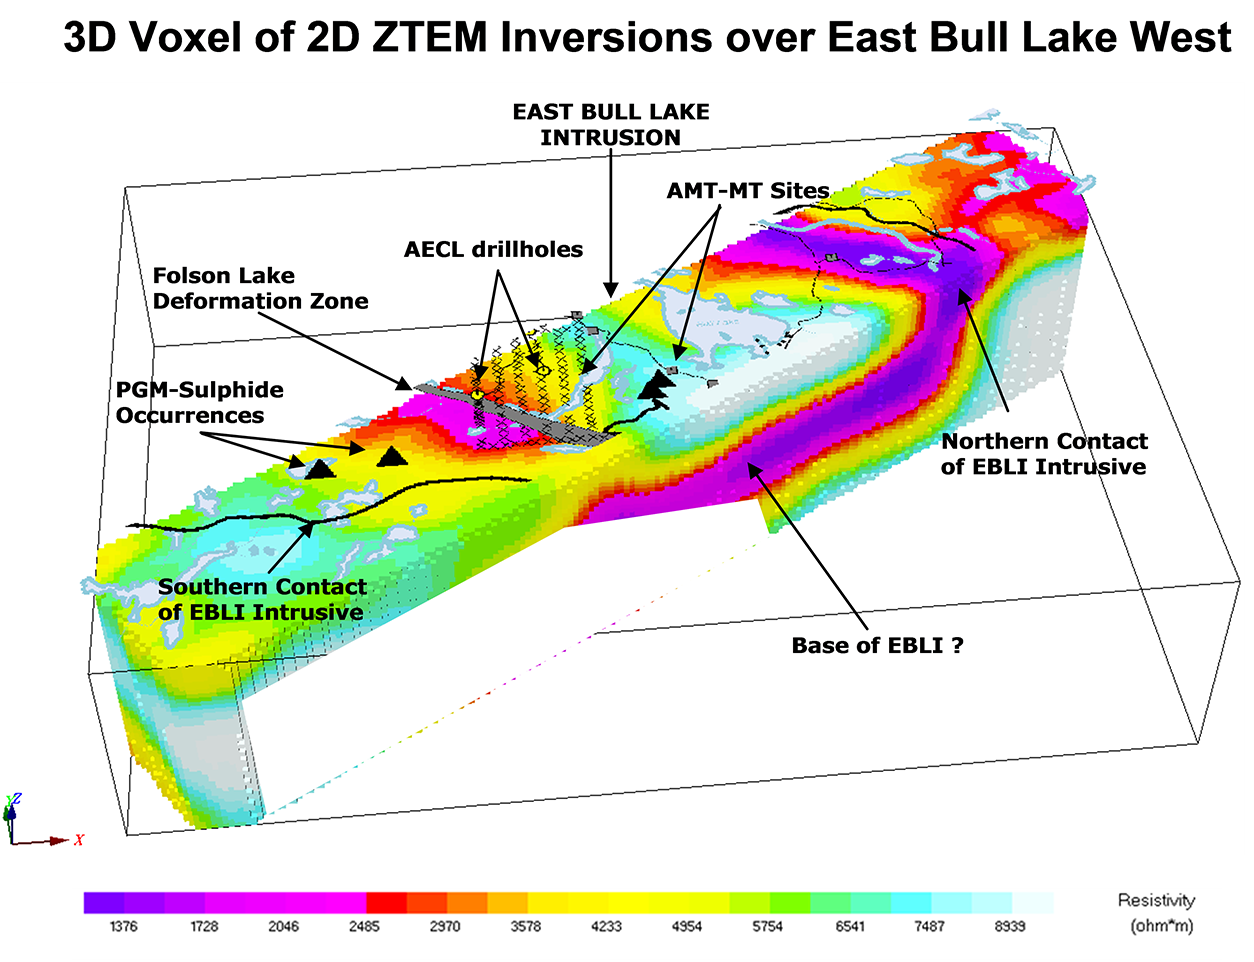
Figure 7 present the 2D cross-sectional resistivity results obtained from the Zvert2D inversion (Legault et al., 2009b) based on the 2D MT codes/methods of Wannamaker et al. (1987), Tarantola (1987) and de Lugao and Wannamaker (1996). Zvert2d utilizes the In-Line (Tzx) ZTEM™ tipper data, an apriori model (in this case, 5k Ω-m half-space) and imposes an “air layer”, below the receiver, in order to obtain a 2D re-sistivity distribution. L1040 directly over the EBLI intrusive indicates that it is a shallower, more resistive body surrounded by lower resistivity rocks at depth and further west, which is consistent with the location of the Folson Lake FLFZ and the northern EBLI contact, which is a known fault-fracture zone. Significantly, the ZTEM™ inversion defines a deep conductive layer at 0.5-1km depth which coincides with the known base of EBLI and agrees with the AMT-MT findings of Kurtz et al. (1986). Figure 8 presents the 3D Voxel of the combined 2D inversions for all West Block lines which highlights the good correlation between ZTEM™ and the known geology.
Conclusions
Helicopter-borne VTEM™ survey results over the East Bull Lake Intrusive Complex have identified weak to moderate conductance anomalies associated with pre-viously unmapped, highly anomalous PGM-sulphide occurrences, many of which have been successfully drill-tested. ZTEM™ AFMAG surveys have defined major structures surrounding the EBLI that strikingly agree with previous AMT-MT findings, as well as drilling, including the fractured PGM-mineralized base of the complex, at 800m depths.
The relative success of the VTEM™ and ZTEM™ surveys at East Bull Lake is in marked contrast to the apparently poor correlation between VTEM™ and ZTEM™ anomalies. This is logically explained by the differences in depth resolution-penetration and relative size-conductivity of the targets each system is most sensitive to. VTEM™ is best suited for high resolution mapping of higher-conductance massive to semi-massive sulphide targets in the 0-500m range – with depth-detectability sensitivity proportional to target size. On the other hand, ZTEM™ is best suited for larger scale and deeper resistivity structures, associated with regional geology and sometimes extending to great depth (1-2km), that depend only on lateral resis-tivity contrasts. It seems that both technologies com-plement each other as mapping tools of targets of dif-ferent scale & style as applied to PGM-sulphide explo-ration.
Certainly, 3D inversion of ZTEM™ (Holtham and Oldenburg, 2008, 2010) and VTEM data could provide valuable insight and further explanation of the relationship between the mineralized zones and con-trolling structures at East Bull Lake.
Acknowledgements
The authors wish to thank Mustang Minerals Corp., joint-venture partner Western Areas NL and Geotech Ltd. for allowing us to show these results and for spon-soring the study.
References
Brisbin, D., Wood, P., Kleinboeck, J., and Lapierre, K., 2001, Geology of the East Bull Lake Intrusion and its contact-type PGE-Cu-Ni mineralization, Field Trip Guidebook, Laurentian University SEG Student Chapter 2ND Annual Workshop in Mineral Exploration, 25 pp
De Lugao, P.P., and Wannamaker P., 1996, Calculating the two-dimensional magnetotelluric Jacobian in finite elements using reciprocity, Geophysical Journal International, 127, 806-810.
Holtham, E., and D. Oldenburg, 2008, Three-dimensional forward modelling and inversion of Z-TEM data, SEG Ex-panded Abstracts, 564-568
Holtham, E., and D. Oldenburg, 2010, Three-dimensional inversion of ZTEM data, SEG Expanded Abstracts, 655-659.
Kurtz, R.D., Ostrowski, J.A., and Niblett, 1986, A magne-totelluric survey over the East Bull Lake Gabbro-Anorthosite Complex, Journal of Geophysical Research, 91, 7403-7416.
Labson, V. F., Becker A., Morrison, H. F., and Conti, U., 1985, Geophysical exploration with audiofrequency natural magnetic fields, Geophysics, Vol. 50, pp. 656-664.
Legault, J.M., H. Kumar, B. Milicevic, and L. Hulbert, 2009, ZTEM airborne tipper AFMAG test survey over a magmatic copper-nickel target at Axis Lake in northern Saskatchewan, SEG Expanded Abstracts, 28, 1272-1276.
Legault, J.M., H. Kumar, B. Milicevic, and P. Wannamaker, 2009, ZTEM tipper AFMAG and 2D Inversion results over an unconformity uranium target in northern Saskatchewan, SEG Expanded Abstracts, 28, 1277-1281.
Lo, B., Legault, J.M., Kuzmin, P., and Combrinck, M., 2009a, Z-TEM (Airborne AFMAG) tests over unconformity uranium deposits, 20TH ASEG International Geophysical Conference & Exhibition, Adelaide, AU, Extended Abstracts, 5 pp.
Lo, B., Legault, J., Kuzmin, P., and Fisk, K., 2009b, Advances in airborne EM: Introducing ZTEM, a paper presented at 11TH SAGA biennial technical meeting and exhibition, 5 pp.
Lo, B., and Zang, M., 2008. Numerical modeling of Z-TEM (airborne AFMAG) responses to guide exploration strategies, SEG Expanded Abstracts, 27, 1098-1101.
Meju, M.A., 1998, Short Note: A simple method of transient electromagnetic data analysis, Geophysics, 63, 405–410.
Orta, M., and Bagrianski, A., 2007, Report on a helicopter-borne versatile time domain electromagnetic (VTEM) geo-physical survey, East Bull Lake property, for Mustang Min-erals Corp., internal report by Geotech Ltd., 28 pp.
Paré, P., and Legault, J.M., 2010, Ground IP-Resistivity, airborne Spectrem and helicopter ZTEM survey results over Pebble copper-moly-gold porphyry deposit, Alaska, SEG Expanded Abstracts, 29, 1734-1738.
Pedersen, L.B., 1998, Tensor VLF measurements: Our first experiences, Exploration Geophysics, 29, 52-57.
Prikhodko, A., Morrison, E, Bagrianski, A., Kuzmin, P., Tishin, P., and Legault, J.M., 2010, Evolution of VTEM – technical solutions for effective penetration, 21ST ASEG International Geophysical Conference & Exhibition, Sidney, AU, Extended Abstracts, 5 pp.
Sattel, D., Thomas, S., and Becken, M., 2010, An analysis of ZTEM data over the Mt Milligan Porphyry Copper Deposit, British Columbia, SEG Expanded Abstracts, 29, 1729-1733.
Sattel, D., Witherly, K., and Becken, M., 2010, A brief anal-ysis of ZTEM data from the Forrestania test site, WA, 21ST ASEG International Geophysical Conference & Exhibition, Sidney, AU, Extended Abstracts, 5 pp..
Tarantola, A., 1987, Inverse Problem Theory, Elsevier, New York, 613 pp.
Venter, N., Legault, J.M., Zhao, S., and Kumar, H., 2010, Report on a helicopter-borne z-axis tipper electromagnetic (ZTEM) and aeromagnetic geophysical survey, East Bull Lake east and west blocks, for Mustang Minerals Corp., internal report by Geotech Ltd., 58 pp.
Vozoff, K., 1972, The magnetotelluric method in the explora-tion of sedimentary basins: Geophysics, 37, 98–141.
Wannamaker, P. E., Stodt, J. A., and Rijo, L., 1987, A stable finite element solution for two dimensional magnetotelluric modeling: Geophysical Journal of Royal Astronomical Socie-ty, 88, 277-296.
Ward, S. H., 1959, AFMAG – Airborne and Ground: Geo-physics, Vol. 24, pp. 761-787.
Witherly, K., and R. Irvine, 2006, The VTEM airborne elec-tromagnetic system – benchmarking continuous improvement via repeat surveys over time, SEG Expanded Abstracts, 25, 1273-1277.
Witherly, K., Irvine, R., and Morrison, E.B., 2004, The Ge-otech VTEM time domain helicopter EM system: SEG Ex-panded Abstracts, 23, 1217-1221.